


Bridge Investment Group Private Equity Returns Analysis is one of the most searched topics among institutional and individual investors evaluating real estate private equity managers — and for good reason.
Here is a quick snapshot of what the data shows:
| Fund / Strategy | Gross IRR | Net IRR | Preqin Ranking |
|---|---|---|---|
| Multifamily Fund IV | 44.7% | 34.4% | 1st Quartile |
| Workforce & Affordable Housing Fund I | 40.1% | 32.2% | 1st Quartile |
| Multifamily Funds (avg, Q3 2023) | – | 17.4% (levered) | 1st Quartile |
| Debt Strategies (avg) | – | 8.6% | – |
| Office Fund I | – | -22.0% (levered) | Underperforming |
Bridge Investment Group grew from a focused real estate manager in 2009 to a firm managing roughly $47.7 billion in AUM by end of 2023 — and was later acquired by Apollo to form a combined $110 billion real estate platform.
Their track record is strong in most strategies. But not all of them.
Understanding which funds performed, why they performed, and where the risks lie is exactly what this article breaks down.
Whether you are evaluating Bridge as a fund manager, studying real estate private equity benchmarks, or just trying to understand how alternative investments work — this guide covers it all in plain language.
Historical Performance and Bridge Investment Group Private Equity Returns Analysis
When we look at the historical data for Bridge Investment Group, the numbers tell a story of rapid growth paired with high-conviction sector bets. As of the current period in April 2026, we can look back at the foundational data from their Bridge Investment Group Holdings Inc. Annual report and subsequent earnings to see how they’ve navigated different market cycles.
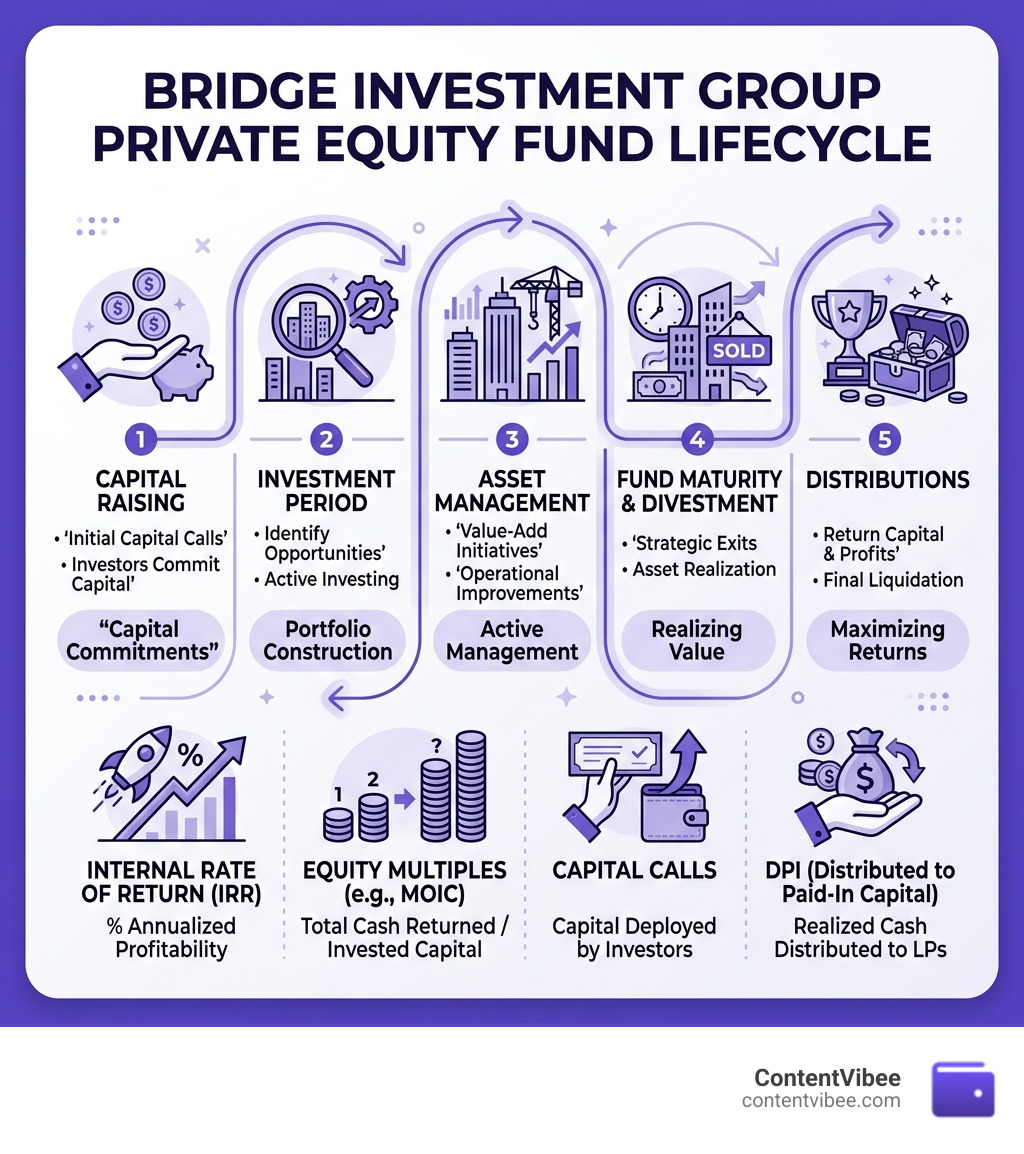
To understand these returns, we have to look at three primary metrics: Internal Rate of Return (IRR), which measures the profitability of investments over time; the Net Multiple (or Equity Multiple), which shows how many dollars were returned for every dollar invested; and Distributed to Paid-In Capital (DPI), which tells us how much hard cash has actually made it back into investors’ pockets.
Multifamily and Workforce Housing Track Record
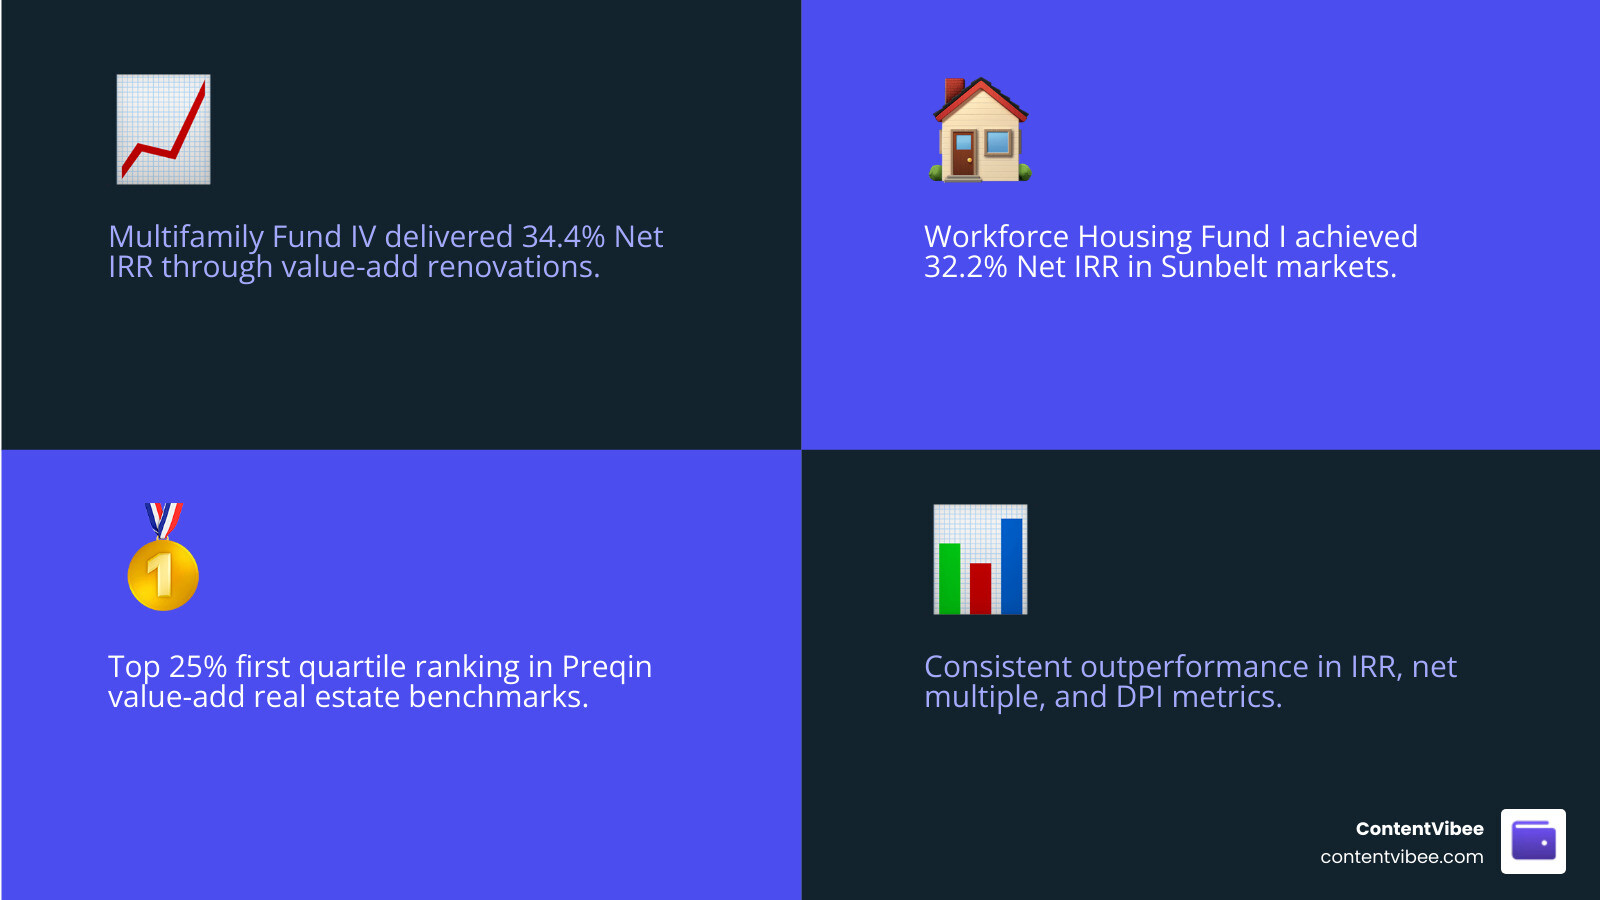
The “bread and butter” of Bridge’s success has historically been their residential platforms. Their Multifamily Fund IV is a standout example, posting a staggering 34.4% Net IRR. Similarly, their Workforce and Affordable Housing Fund I delivered a 32.2% Net IRR.
These returns weren’t just luck. We see a consistent strategy of targeting “value-add” properties in high-growth Sunbelt markets. By taking older or under-managed apartment complexes and renovating them (the “value-add” part), they were able to drive rental income growth and stabilize occupancy at high levels—often around 95% even during volatile periods. This combination of realized returns from property sales and unrealized appreciation in the remaining portfolio has kept their residential funds at the top of the charts.
Benchmarking Against Preqin Quartile Rankings
In private equity, “good” is relative. That’s why we use Preqin Ltd rankings to see how Bridge stacks up against its peers. According to Preqin, each of Bridge’s three most recent multifamily funds ranked in the first overall quartile among value-add real estate funds of the same vintage year.
Being in the “first quartile” means they performed in the top 25% of all similar funds globally. Their Workforce and Affordable Housing fund also secured a first-quartile spot for IRR, net multiple, and overall return. For institutional investors like pension funds or university endowments, this consistent top-tier performance is the gold standard they look for when committing capital.
Strategic Drivers of Private Equity Performance
Why does Bridge often outperform the broader market? A huge part of the answer lies in their “vertically integrated” business model.
Unlike many “allocators” who simply write checks to other companies to manage buildings, Bridge does almost everything in-house. They have specialized teams for property management, leasing, and even construction management. This vertical integration allows them to capture more of the “alpha” (excess return) by controlling costs and executing renovations more efficiently than a third-party contractor might.
As noted in the Bridge Reports Fourth Quarter and Full Year 2023 Results, this model helped them scale their Assets Under Management (AUM) from $20 billion in 2009 to nearly $50 billion today.
Impact of Specialized Platforms on Bridge Investment Group Private Equity Returns Analysis
Bridge hasn’t just stuck to apartments. They’ve expanded into several specialized “verticals” that have distinct return profiles:
- Logistics Properties: Capitalizing on the e-commerce boom, Bridge has moved heavily into industrial warehouses. With e-commerce sales growing nearly 100% over the last five years, these “mission-critical” assets have become a powerhouse for returns.
- Single-Family Rental (SFR): By acquiring and managing thousands of single-family homes, Bridge tapped into the structural shortage of housing in the U.S.
- Industrial Net Lease: This strategy focuses on long-term leases (7-20 years) where the tenant pays for taxes, insurance, and maintenance. It provides a very stable, bond-like income stream with 2-3% annual rent bumps.
Alignment of Interests and Fee Structures
One thing we always look for in Bridge Investment Group Private Equity Returns Analysis is “skin in the game.” Bridge’s owners, employees, and affiliates have committed over $485 million of their own money to their funds. When the managers’ own bank accounts are on the line, they tend to be much more careful with investor capital.
Their fee structure also supports stability. Over 97% of their fee-earning AUM is held in closed-end funds with long durations (averaging 7 to 8 years). This means investors can’t just pull their money out during a market panic, allowing Bridge to wait for the right time to sell assets at a profit. This results in recurring management fees that provide the firm with a steady base of income, while “carried interest” (performance fees) incentivizes them to knock returns out of the park.
Risk Factors and Market Volatility Impact
It hasn’t all been sunshine and high IRRs. The real estate market faces significant headwinds, particularly as we look at the legacy of the early 2020s.
The biggest “black mark” on the recent track record has been the Office sector. Due to the shift toward remote work and changing economic cycles, Bridge’s Office Fund I saw a levered net IRR of -22.0%. In late 2023, the firm even had to write off about $5.7 million in uncollectible fees from an office fund. This serves as a stark reminder that even top-tier managers aren’t immune to massive structural shifts in how society uses real estate.
Other risks include:
- Interest Rate Sensitivity: Higher rates make it more expensive to borrow money to buy properties, which can squeeze profit margins.
- Tenant Credit Risk: In their net lease and industrial sectors, if a major tenant goes bust, it can take a long time to find a replacement.
- Liquidity Constraints: Because these are private funds, you can’t just sell your “shares” on a stock exchange. Your money is locked up for years.
Forward-Looking Bridge Investment Group Private Equity Returns Analysis
The biggest news for Bridge’s future was the acquisition by Apollo Global Management. By joining forces, they created a $110 billion real estate business. This gives Bridge access to Apollo’s massive “dry powder” (cash waiting to be invested) and global reach.
As we move through 2026, Bridge is doubling down on “growth markets” and Opportunity Zones (QOZ), which offer significant tax breaks for investing in distressed areas. They are also expanding their debt strategies, acting as a lender to other real estate owners—a move that often performs well when equity markets are volatile.
Frequently Asked Questions about Bridge Fund Performance
What is the average IRR for Bridge Multifamily funds?
Historically, Bridge’s multifamily funds have been their strongest performers. While individual funds vary, recent data shows a levered net IRR range of 15.7% to 17.4% across the platform. Some specific vintage funds, like Multifamily Fund IV, have seen net IRRs as high as 34.4%. These returns are driven by their value-add execution—buying underperforming properties and fixing them up to increase rental income.
How does Bridge Investment Group align with its investors?
They use a “General Partner (GP) Commitment” strategy. As of the end of 2021, Bridge affiliates and employees had committed over $485 million to their own funds. Additionally, their performance fees (carried interest) are generally only paid out after investors have received a “preferred return” (usually around 8%), ensuring the firm only gets a bonus if the investors are already winning.
What are the primary risks to Bridge’s private equity returns?
The primary risks include macroeconomic shifts (like a recession lowering demand for apartments), interest rate hikes (increasing the cost of debt), and sector-specific volatility. As seen with their office funds, a shift in how people work can lead to negative returns in specific asset classes. Refinancing risk is also a factor; if a fund needs to pay off a loan when interest rates are high, it can eat into the final profits.
Conclusion
Bridge Investment Group has established itself as a leader in the alternative investment space by focusing on high-conviction sectors and maintaining a vertically integrated “hands-on” approach to management. While the office sector has proven challenging, their dominance in multifamily, workforce housing, and logistics has provided investors with strong risk-adjusted returns and consistent first-quartile rankings.
As part of the larger Apollo platform, Bridge is now positioned with the scale and capital to navigate the complexities of the 2026 real estate market. For investors, the key takeaway is that specialized expertise and aligned incentives remain the strongest drivers of long-term private equity performance.
At ContentVibee, we believe that everyone should have access to clear, comparative information about their financial and legal options. If you’re looking to dive deeper into how private markets affect your financial health, you can Access more resources on money and credit on our main site. Whether you’re an institutional pro or just starting your investment journey, staying informed is your best defense against market volatility.


