


Why the Cost Margin Formula Is the Number Every Small Business Owner Must Know
The cost margin formula is one of the most important calculations you can make for your business — and one of the most misunderstood.
Here’s the quick answer:
Gross Profit Margin = (Revenue − Cost of Goods Sold) ÷ Revenue × 100
For example:
- Revenue: $50,000
- Cost of Goods Sold (COGS): $30,000
- Gross Profit: $20,000
- Gross Margin: 40%
That 40% means you keep $0.40 from every dollar of revenue after covering direct production costs.
You could be selling like crazy and still be losing money. That’s the hard truth behind ignoring your margins. Revenue tells you how much came in. Margin tells you how much you actually kept.
The average gross profit margin across all industries sits around 36.56%, and the average net profit margin is just 8.54%. But those numbers vary wildly by industry — which is exactly why you need to understand what your margin means for your business.
Whether you’re pricing a product, pitching to investors, or just trying to figure out if your business is healthy, the cost margin formula is where you start.
Demystifying the Cost Margin Formula: Gross Profit Margin Explained
To understand the cost margin formula, we first need to break down its core components: revenue, gross profit, and the cost of goods sold (COGS).
At its heart, gross profit represents the money your business has left over after paying for the direct expenses required to make your products or deliver your services. If you run a bakery, your COGS includes flour, sugar, yeast, and the direct labor of the baker. It does not include your shop’s rent, your internet bill, or your marketing budget.
Your gross profit margin is this dollar figure expressed as a percentage of your total sales. This percentage is a direct reflection of your pricing power and production efficiency. A high gross margin indicates that you can produce your offerings cheaply or charge a premium price. A low gross margin, on the other hand, means you are operating on razor-thin wiggle room, leaving you vulnerable to even minor supply chain disruptions or cost increases.

Step-by-Step Calculation Using the Cost Margin Formula
Calculating your margin is a straightforward process once you have organized your books. Let’s walk through the steps to apply the cost margin formula to your business:
- Calculate Net Sales (Revenue): This is your total gross sales minus any customer returns, discounts, or allowances.
- Calculate Cost of Goods Sold (COGS): Add up all direct costs associated with producing your goods or services. This includes raw materials, direct manufacturing labor, and factory overhead.
- Subtract COGS from Net Sales: This gives you your Gross Profit in dollars.
- Divide Gross Profit by Net Sales: This shows the portion of each sales dollar that is profit.
- Multiply by 100: Convert the decimal into a clean percentage.
Let’s look at a quick real-world scenario. Imagine a California-based boutique retail shop that generates $150,000 in net sales over a quarter. The wholesale cost of the inventory sold, plus shipping and packaging, comes out to $60,000.
- Gross Profit: $150,000 – $60,000 = $90,000
- Gross Profit Margin: ($90,000 ÷ $150,000) × 100 = 60%
In this case, the business retains $0.60 of every dollar earned to cover operating expenses and contribute to the bottom line. For more guidance on organizing your business financials to track these figures, check out the SBA Guide on Managing Business Finances.
What High vs. Low Gross Margins Indicate About Your Business
What does your calculated percentage actually say about your business?
A high gross margin is a sign of strong financial health. It demonstrates that you possess significant pricing leverage—meaning customers value your brand enough to pay a premium, or you have optimized your supply chain to keep production costs exceptionally low. High margins give you a safety net; if material costs spike, your business can absorb the blow without immediately slipping into a loss.
A low gross margin indicates that your direct production costs are consuming most of your revenue. This could point to several underlying issues:
- Your suppliers are charging you too much.
- Your production process is inefficient or wasteful.
- You are locked in a price war, sacrificing your pricing power to maintain market share.
While some high-volume businesses can survive on low margins, it leaves very little room for error. If your gross margin is low, a slight drop in sales volume or a minor increase in utility rates can quickly push your business into the red.
Gross Margin vs. Operating and Net Margins: What is the Difference?
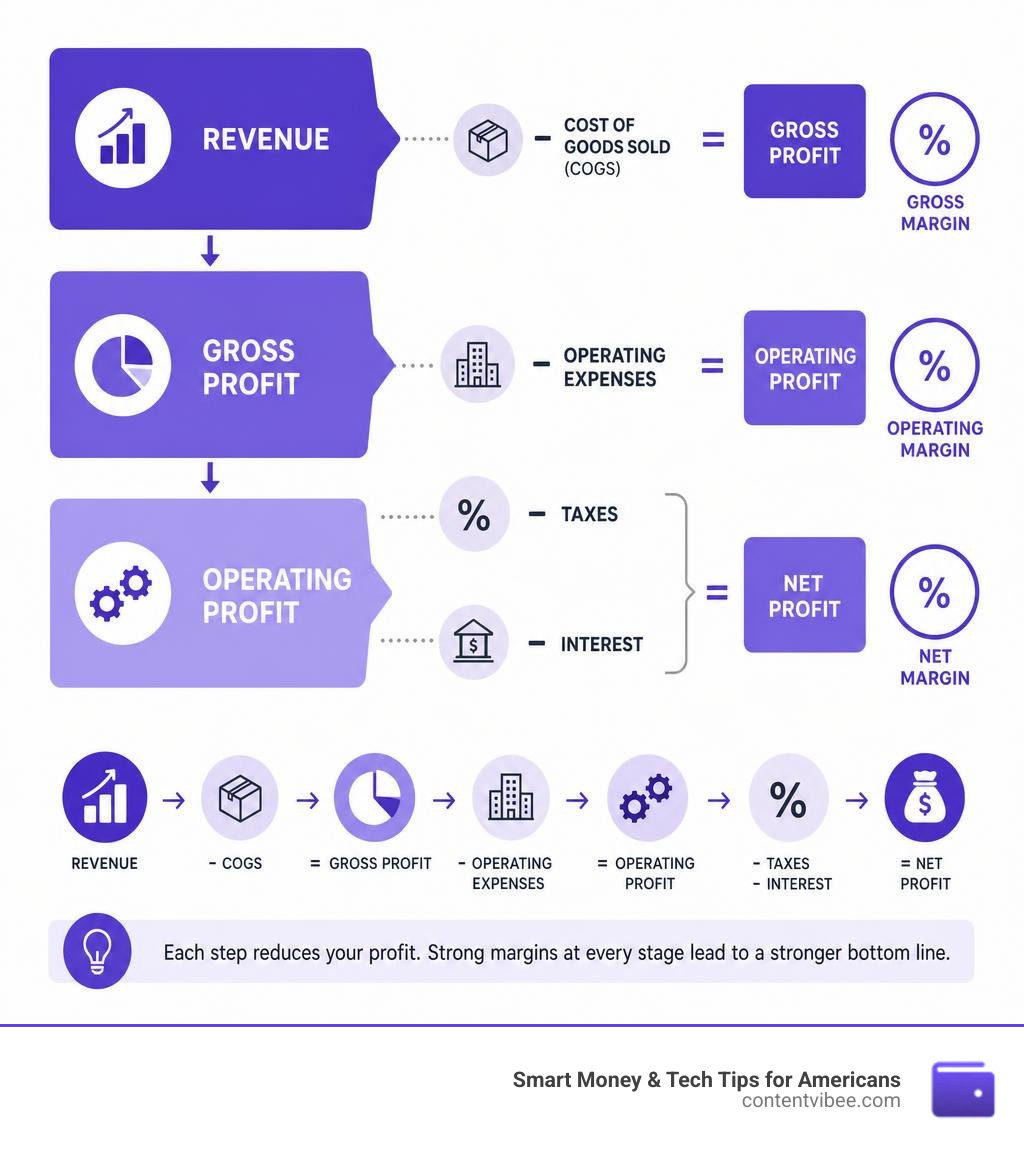
One of the most common mistakes we see small business owners make is tracking only a single margin type. To truly understand your company’s financial story, you must look at the three distinct levels of profitability: gross, operating, and net margins.
Think of your income statement as a filter. Revenue enters at the top, and various expenses are subtracted at each stage until only the pure profit remains at the bottom.
| Margin Type | Formula | What It Measures | What It Includes |
|---|---|---|---|
| Gross Profit Margin | (Gross Profit ÷ Revenue) × 100 | Production efficiency and pricing power | Only direct costs of production (COGS) |
| Operating Profit Margin | (Operating Income ÷ Revenue) × 100 | Operational efficiency and overhead management | COGS plus SG&A, rent, utilities, depreciation, and amortization |
| Net Profit Margin | (Net Income ÷ Revenue) × 100 | Overall business profitability (the bottom line) | All expenses, including taxes, interest, and one-time costs |
Operating Profit Margin: Measuring Business Efficiency
Once you subtract your COGS from your revenue, you are left with gross profit. But your business still has to pay for overhead costs like rent, administrative salaries, marketing, and insurance—often grouped as Selling, General, and Administrative (SG&A) expenses.
Your operating profit margin takes these overhead costs into account, along with depreciation and amortization. It measures how efficiently you manage not just your production line, but your entire business operation.
For example, if a consulting firm has a spectacular gross margin because they have virtually no COGS, but they spend excessively on luxury office spaces and aggressive marketing, their operating profit margin will be low. This indicates that while their core service is highly profitable, their overhead expenses are draining those profits away.
Net Profit Margin: The Ultimate Bottom Line
At the very bottom of the filter lies the net profit margin. This metric accounts for absolutely everything: COGS, operating expenses, interest payments on business loans, and state and federal taxes.
This is the ultimate bottom-line figure that investors, lenders, and buyers focus on when evaluating your business valuation. It tells them exactly how much cash is left over to be reinvested back into the business or distributed to the owners.
While a typical net profit margin falls between 5% and 10% across the broader economy, a 5% net margin is generally considered poor, 10% is okay, and 20% or higher is considered excellent. However, a company can easily show a strong gross profit margin while quietly bleeding cash at the net level due to heavy debt interest or tax burdens.
Markup vs. Margin: The Crucial Distinction for Pricing Strategy
In our financial advisory work, we have found that confusing markup with margin is the single most common pricing error in small-business spreadsheets. While both terms use the exact same dollar figures, they use entirely different denominators, leading to completely different percentages.
- Margin is profit expressed as a percentage of the selling price (revenue).
- Markup is profit expressed as a percentage of the cost of the product.
If you don’t know the difference, you are likely underpricing your products and leaving thousands of dollars on the table.
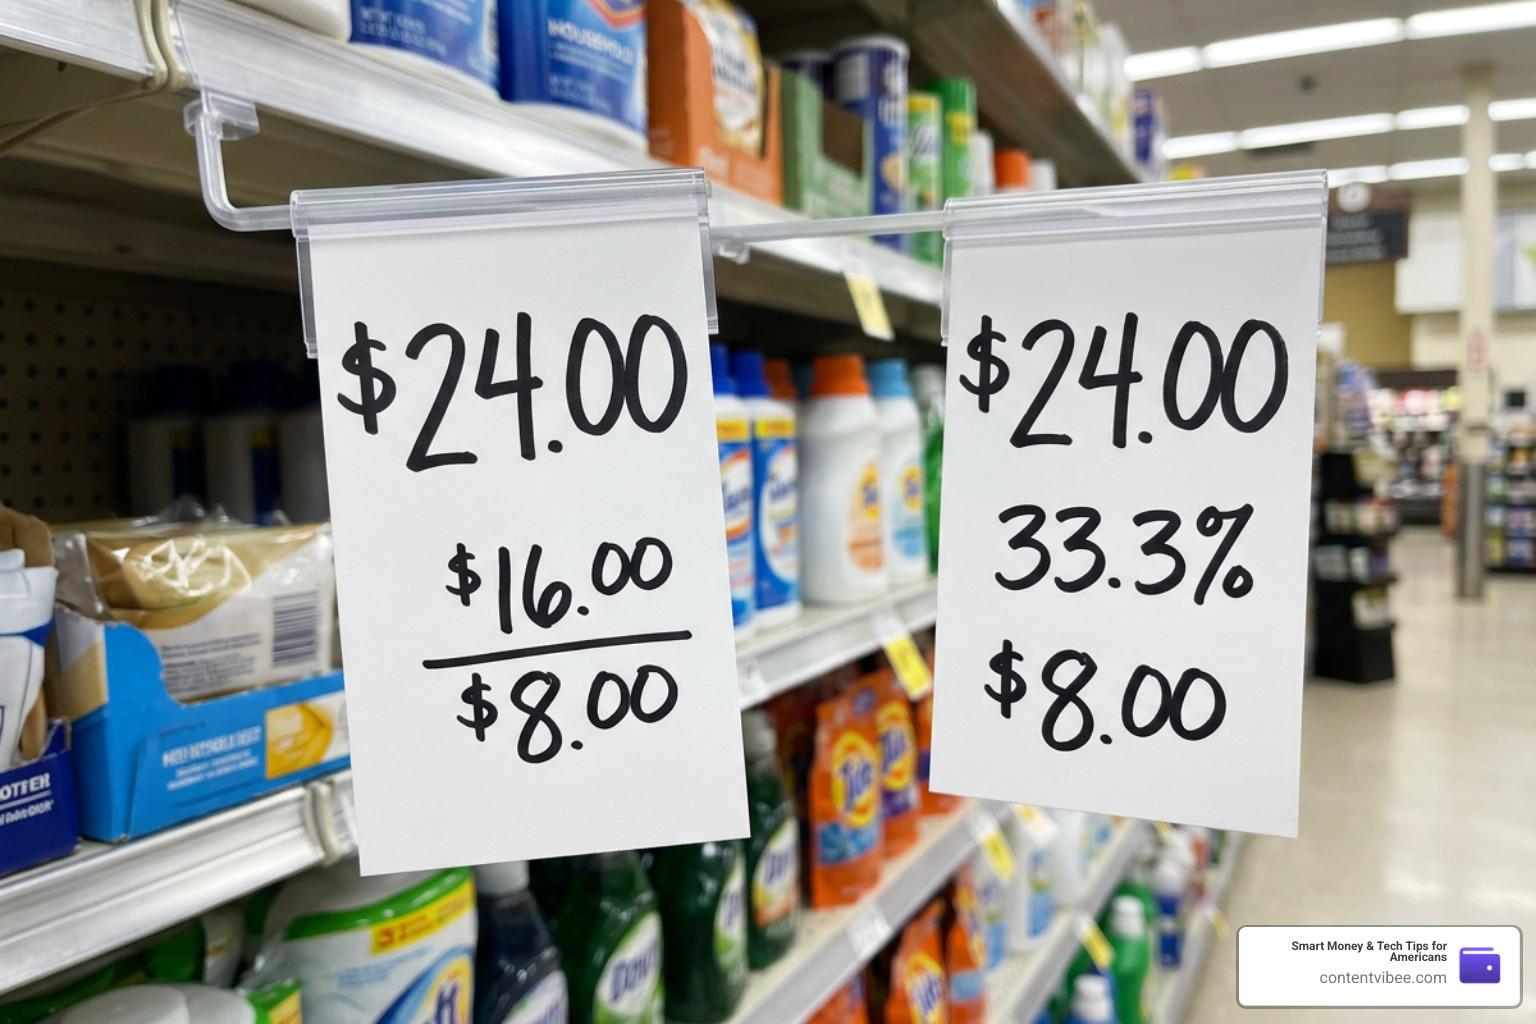
To make sure you are pricing your products safely, you can use our interactive Markup to Margin Calculator to instantly convert between the two.
Why Confusing Markup with the Cost Margin Formula Hurts Pricing
Let’s look at how confusing these two terms can devastate your unit economics.
Suppose you buy an item for $100 and want to make a 25% profit on it.
If you mistakenly apply a 25% markup to your cost:
- You add 25% of $100 ($25) to the cost.
- Your selling price is set at $125.
- Your actual profit margin is $25 divided by the $125 selling price, which is only 20%.
If you actually needed a 25% gross margin to cover your overhead:
- You must divide your cost by
(1 - 0.25), which is0.75. - Your selling price should be $133.33 (requiring a 33.3% markup).
- By confusing the two, you underpriced your item by $8.33, directly sacrificing your bottom-line revenue.
This pricing gap compounds rapidly at scale. A 50% markup corresponds to only a 33.33% margin, and you must apply a full 100% markup (doubling your cost) just to achieve a 50% gross margin.
Contribution Margin vs. Gross Margin
Another critical distinction is contribution margin versus gross margin. While gross margin is designed for external financial reporting under GAAP, contribution margin is an invaluable tool for internal decision-making and break-even analysis.
- Gross Margin subtracts both variable and fixed manufacturing overhead costs from your sales revenue.
- Contribution Margin subtracts only variable costs (both manufacturing and non-manufacturing, like sales commissions) from revenue.
This calculation shows how much of each sale directly contributes to covering your fixed costs (like building rent and permanent staff salaries) before profit is generated. For a detailed breakdown of how to use these formulas for your internal product planning, read through the Contribution Margin Definition and Calculations – Business LibreTexts/03%3ACost-Volume-ProfitAnalysis/3.02%3AExplainContributionMarginandCalculateContributionMarginperUnitContributionMarginRatioandTotalContributionMargin).
Industry Benchmarks: Why You Must Compare Within Your Sector
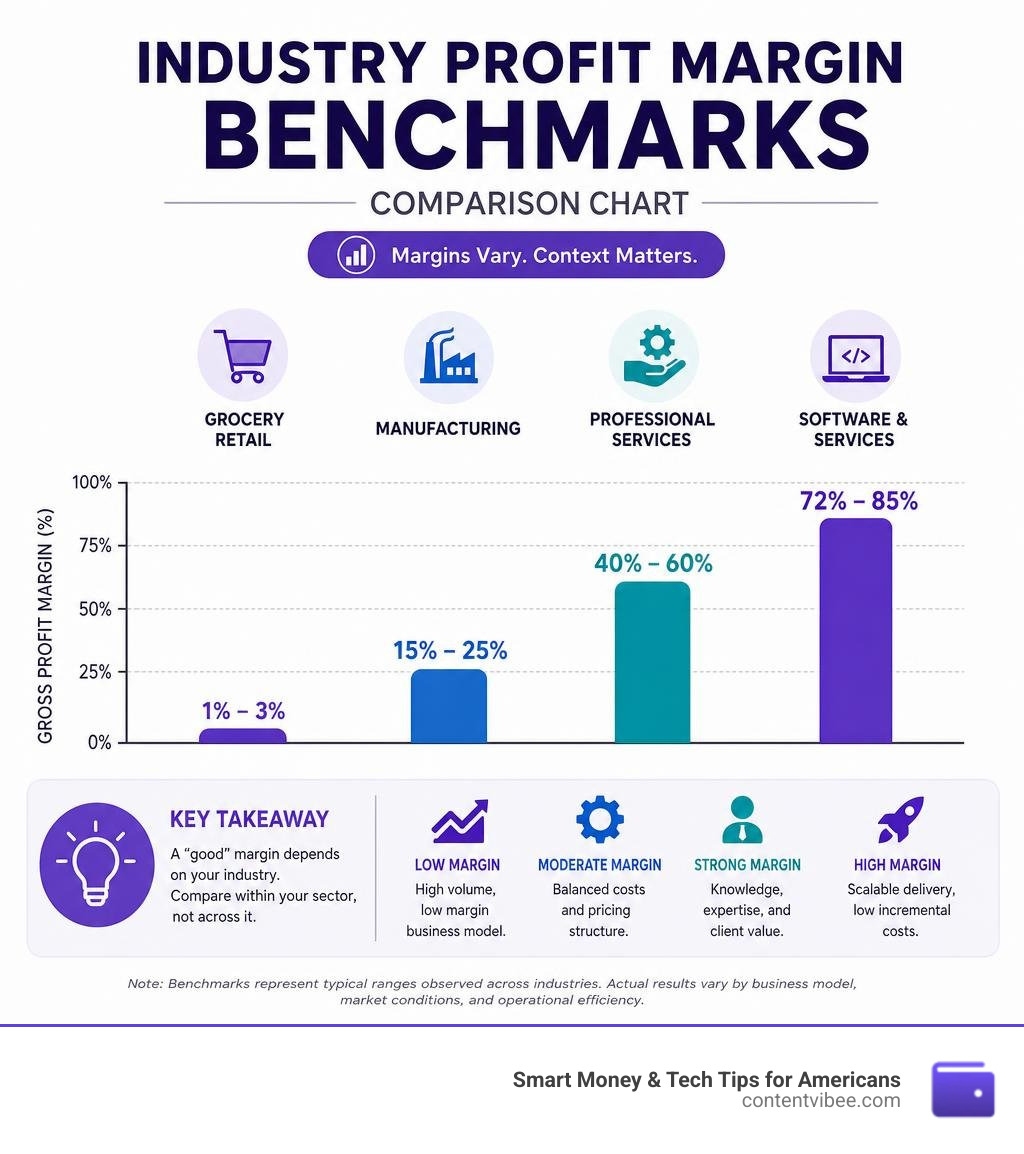
Comparing your margins to a broad, cross-industry average is a recipe for confusion. A “good” margin is entirely relative to your specific industry sector.
For instance, a local grocery store might operate on a razor-thin net profit margin of 1% to 3% because they move massive volumes of inventory every day. Conversely, a luxury jewelry boutique or a software provider might require margins north of 70% because their transaction volumes are much lower and their upfront development or marketing costs are incredibly high.
High-Margin Sectors: Software and Services
Software-as-a-Service (SaaS) and application software companies boast some of the highest gross profit margins in the economy, averaging 72.38% (with some reaching up to 85%).
These businesses have incredibly low COGS because once the software is built, the cost to deliver it to an additional customer—such as server hosting and basic payment processing fees—is virtually pennies. This extreme scalability allows software companies to reinvest heavily in research, development, and aggressive marketing.
Professional service firms, such as consulting, dental, and legal practices, also enjoy strong gross margins (often 50% to 70%) because their primary input is expertise rather than expensive physical raw materials.
Low-Margin Sectors: Retail and Manufacturing
On the other end of the spectrum, traditional retail, food wholesalers, and automotive manufacturing operate in low-margin environments:
- Food Wholesalers: Average a tight 15.36% gross margin due to perishable inventory and highly competitive markets.
- Auto and Truck Manufacturing: Typically see gross margins around 11.11% due to massive factories, heavy raw material costs, and intensive union labor.
- General Retail: Usually hovers around 32.22% gross margins.
If you run a business in these sectors, your focus must be on high inventory turnover, tight cost control, and maximizing operational efficiency to ensure your high volume translates into actual profit at the end of the year.
Actionable Strategies to Improve Your Gross Profit Margin
If your margin analysis reveals that your numbers are slipping, don’t panic. There are several practical, high-impact strategies you can implement to optimize your profitability.
Reducing Cost of Goods Sold (COGS)
The most direct way to widen your gross margin is to lower the cost of producing your goods or services. Here are a few ways to tackle COGS:
- Negotiate with Suppliers: Don’t simply accept price increases. Ask for volume discounts, negotiate early-payment discounts (e.g., 2/10 net 30), or source alternative vendors to create healthy competition.
- Minimize Waste: Audit your production process. If you run a restaurant, track food spoilage. If you run a manufacturing shop, look for ways to optimize material cuts and reduce scrap.
- Automate Repetitive Tasks: Investing in modern equipment or software can reduce direct labor hours per unit, lowering your overall variable costs over time.
Strategic Pricing and Discount Guardrails
Sometimes, the problem isn’t your cost—it’s your pricing. You can boost your margins by implementing structured pricing guardrails:
- Implement Value-Based Pricing: Move away from cost-plus pricing. Price your products based on the value and solutions they provide to your customers, rather than just adding a flat markup to your costs.
- Establish Discount Approval Processes: Uncontrolled discounting by eager sales staff is a silent margin killer. Create strict rules—such as requiring manager approval for any discount over 10%—to protect your unit economics.
- Optimize Your Product Mix: Not all products are created equal. Identify your highest-margin offerings and focus your marketing and sales efforts on promoting those specific items, while phasing out low-margin, high-effort products.
Leveraging Technology: How to Monitor and Optimize Profitability
In the modern business landscape, you don’t need to manually calculate these formulas on a legal pad every week. Utilizing specialized financial tools and accounting software can automate your tracking and give you real-time visibility into your financial health.
By integrating your point-of-sale (POS) systems with accounting platforms, you can automatically track fluctuations in your COGS and instantly see how those changes impact your margins. To make this process even simpler, you can use our free suite of business tools at the Margin Calculator page to run quick sanity checks on your product pricing.
Why Accountants and CFOs Rely on Margin Calculators
Professional accountants and fractional CFOs don’t guess when it comes to pricing. They use dedicated calculators to establish strict guardrails that prevent business owners from underpricing their services out of fear or market pressure.
If you want to transition your business from surviving to thriving, learning how to leverage these tools is essential. For professional service providers and financial advisors, our guide on the Margin Calculator For Accountants Stop Undercharging And Start Multiplying Your Profits outlines exactly how to build a highly profitable advisory model around deep margin analysis.
Frequently Asked Questions about Cost Margins
What is a good gross profit margin for a small business?
A good gross profit margin depends heavily on your industry. However, as a general rule of thumb, product-based companies should aim for a gross margin between 50% and 70% to comfortably cover their operating overhead. For service-based businesses, a gross margin of 60% or higher is typical. Across all sectors, achieving a net profit margin of 10% to 20% is considered healthy and sustainable.
Can a business have a negative gross profit margin?
Yes. A negative gross profit margin occurs when your Cost of Goods Sold exceeds your total revenue—meaning it costs you more to make the product than what you sell it for. This is a severe pricing emergency or a sign of massive supply chain disruption. While early-stage startups might intentionally run a negative net margin while scaling up, a negative gross margin means you are losing money on every single sale, which is unsustainable even in the short term.
Why does gross margin matter more than net margin in year one?
In your first year of business, your net margin will often be negative because of high upfront, fixed overhead costs (like equipment purchases, lease deposits, and initial marketing campaigns).
Your gross margin is the key diagnostic metric during this phase because it proves whether your unit economics actually work. A 60% gross margin with a negative net margin is simply a scaling problem—as your sales volume grows, your gross profit will eventually rise to cover your fixed overhead. However, a 15% gross margin is a pricing or cost problem that no amount of sales volume will ever fix.
Conclusion
At Smart Money & Tech Tips for Americans, we believe that long-term financial planning and business growth start with mastering the fundamentals of your cash flow. Revenue is a vanity metric; profit margin is where real business sanity and sustainability live.
By consistently applying the cost margin formula, understanding the critical difference between markup and margin, and benchmarking your performance within your specific industry, you can make empowered, data-driven decisions that protect your bottom line.
Ready to take the guesswork out of your pricing strategy? Bookmark our interactive Omni Margin Calculator to instantly analyze your costs, target margins, and optimal selling prices today.


