


Why Profit Margins Are the Number Every Accountant Should Know Cold
A margin calculator for accountants is one of the most practical tools you can add to your workflow — and if you’re not using one, you’re likely leaving money on the table.
Quick answer: How to calculate profit margin for your firm or clients
| Margin Type | Formula | What It Tells You |
|---|---|---|
| Gross Profit Margin | (Revenue – COGS) ÷ Revenue × 100 | Profitability after direct costs |
| Net Profit Margin | (Revenue – All Expenses) ÷ Revenue × 100 | Overall bottom-line profitability |
| Markup | Profit ÷ Cost × 100 | How much above cost you’re charging |
Healthy benchmarks to know (as of June 2026):
- Net margin below 5% = low
- Net margin around 10% = healthy
- Net margin above 20% = strong performance
- Average across all US industries: ~8.54% net, ~36.56% gross
Here’s the uncomfortable truth: the average net profit margin across all US industries sits at just 8.54%. For accounting firms and their clients, that number can easily slip lower when pricing is set by gut feel rather than hard data.
Most accountants are excellent at reading financial statements. But setting their own prices? That’s where things get fuzzy.
When you don’t know your margins precisely, two things happen:
- You underprice services and erode profitability without realizing it
- You advise clients on financial health while your own numbers are unclear
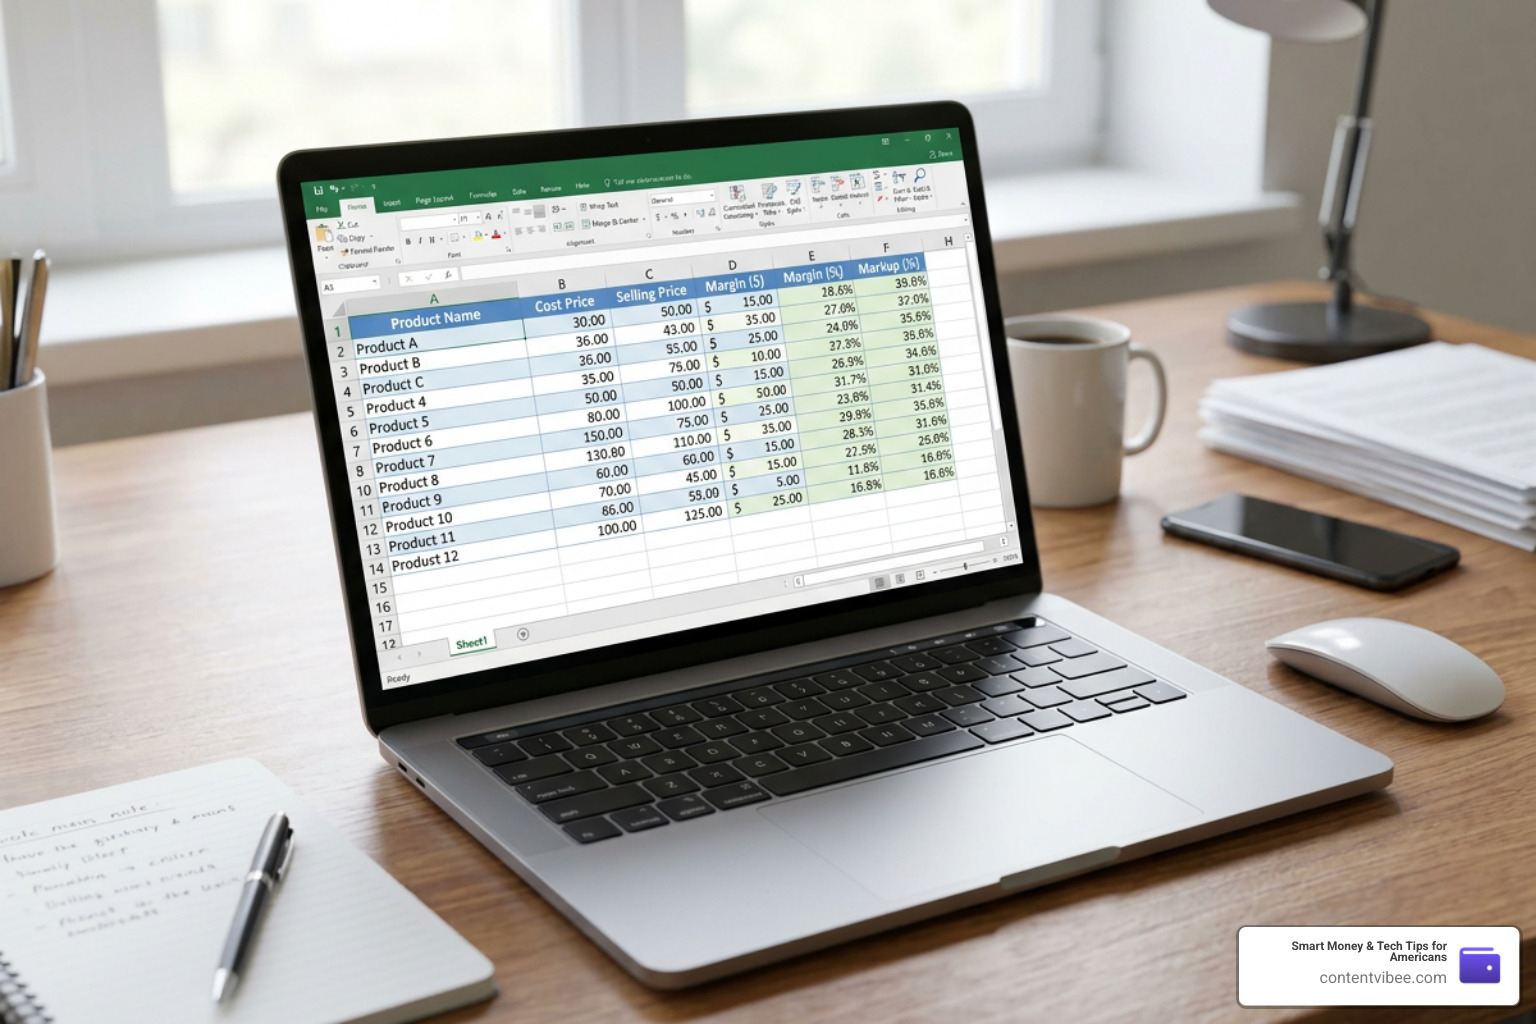
A margin calculator fixes both problems fast. It turns a few simple inputs — revenue, cost, and profit — into clear percentages you can act on immediately.
Why Every Firm Needs a Dedicated Margin Calculator for Accountants
As accounting professionals, we spend our days managing other people’s money. We balance ledgers, optimize tax strategies, and ensure compliance. Yet, when it comes to measuring our own firm’s profitability, we often fall back on outdated spreadsheets or, worse, simple guesswork.

Using a generic calculator might work for a basic retail business, but professional services require a more nuanced approach. A specialized margin calculator for accountants allows us to evaluate client engagements, assess team productivity, and price our advisory services with absolute confidence.
If we want to transition from traditional compliance work to high-value strategic advisory, we must first master our own unit economics. To discover more resources that can help streamline your firm’s operations, check out More info about finance tools.
What is a Profit Margin Calculator and How Does It Work?
At its core, a profit margin calculator is a mathematical tool designed to help you understand the relationship between your revenue, your costs, and the resulting profits. Instead of forcing you to manually run algebraic equations every time you want to price a new project, the tool does the heavy lifting instantly.
The calculator operates using three primary inputs:
- Revenue (or Selling Price): The total amount of money earned from a service or product.
- Cost (or Cost of Goods Sold / COGS): The direct expenses incurred to deliver that service or product.
- Profit: The net dollar amount left over after subtracting costs from revenue.
By inputting any two of these variables, a robust tool like our Free online margin calculator will instantly compute the remaining metrics, including your gross margin percentage and markup percentage.
For instance, if you know a specialized tax planning package costs your firm $1,200 in staff labor and software overhead, and you want to achieve a 60% gross margin, the calculator will immediately tell you that your selling price must be $3,000.
How to Use a Margin Calculator for Accountants to Set Client Pricing
Setting prices is one of the most stressful tasks for any firm owner. Should you charge by the hour? Should you use flat-rate monthly billing? Or is value-based pricing the way to go?
Regardless of your chosen billing philosophy, a margin calculator for accountants is essential for ensuring your rates are sustainable. Let’s look at how to apply it across different pricing strategies:
- Auditing Hourly Rates: If you still bill by the hour, you must ensure your hourly rate covers more than just the accountant’s salary. You need to account for non-billable administrative time, software licenses, and firm overhead. If an employee costs you $45 an hour in wages and benefits, but your firm’s overhead adds another $25 per hour of operational cost, your true cost is $70. To achieve a healthy 50% margin, you cannot simply charge $90 or $100 per hour; you need to price that hour at $140.
- Structuring Flat-Rate Engagements: For monthly bookkeeping or fractional CFO services, use the calculator to model your scope. Estimate the total hours required, multiply by your fully loaded cost rate, and plug that cost into our tool to determine the ideal monthly retainer.
- Refining Value-Based Pricing: When pricing based on the perceived value to the client, use the calculator in reverse. If you charge a flat $5,000 for a complex corporate restructuring that only takes your team $1,000 worth of time and resources to execute, you can easily verify that you are operating at an incredible 80% margin.
To start modeling your own pricing scenarios right now, you can Calculate margins online using our interactive suite.
The Core Formulas: Margin, Markup, and Profitability Metrics
To use these tools effectively, we must be completely aligned on the mathematical formulas running behind the scenes.
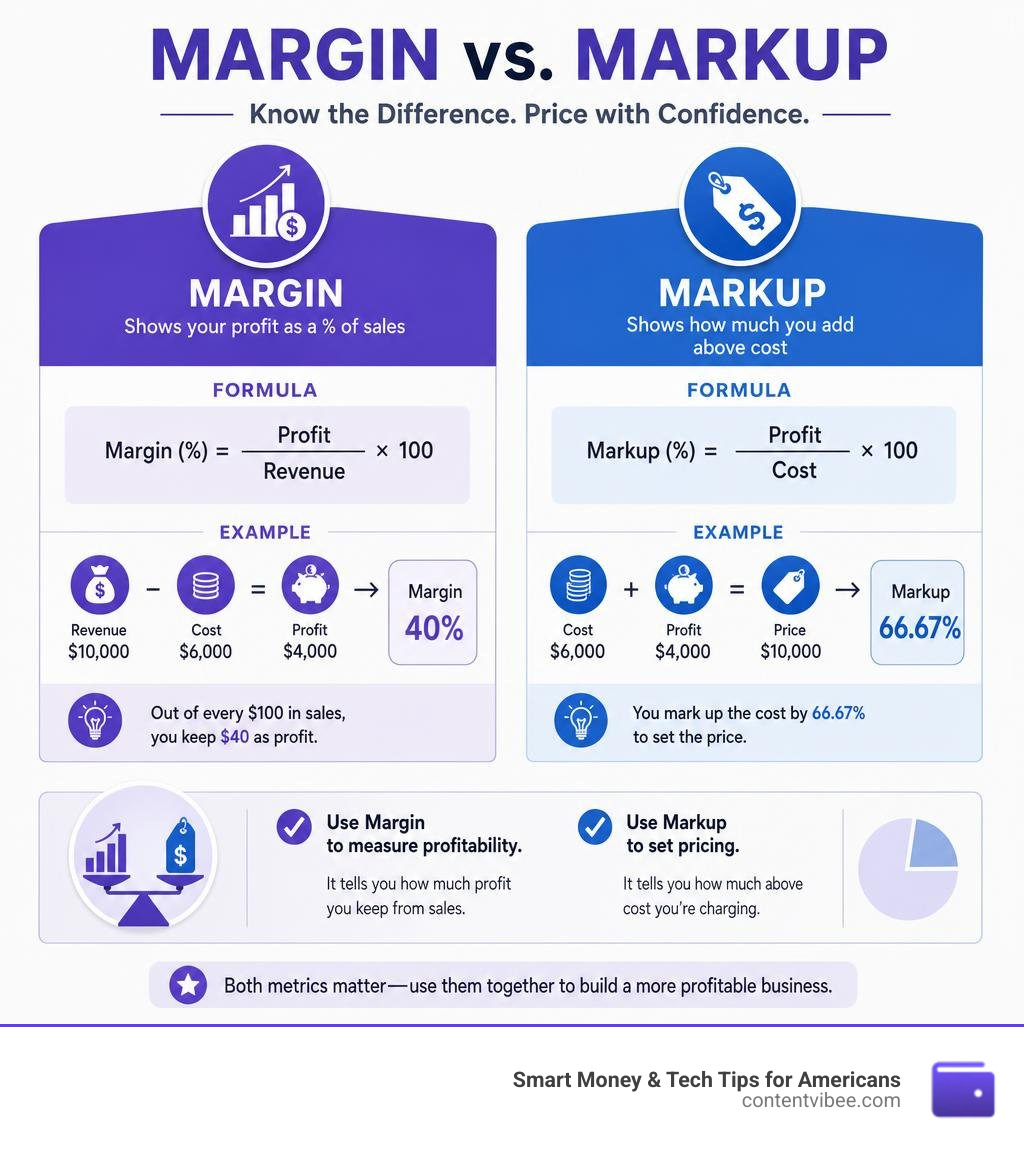
While “margin” and “markup” are frequently used interchangeably in casual business conversations, they represent entirely different financial realities. Confusing the two is one of the quickest ways to accidentally underprice your services and find your firm in a cash crunch.
To keep these metrics straight, let’s look at how they compare side-by-side:
| Metric | Formula | Base Value | Example (Cost: $100, Selling Price: $150) |
|---|---|---|---|
| Profit | Revenue – Cost | Absolute Dollars | $150 – $100 = $50 Profit |
| Profit Margin | (Profit ÷ Revenue) × 100 | Selling Price (Revenue) | ($50 ÷ $150) × 100 = 33.33% Margin |
| Markup | (Profit ÷ Cost) × 100 | Cost Price | ($50 ÷ $100) × 100 = 50% Markup |
As you can see, the exact same transaction yields a 33.33% margin but a 50% markup. If you tell a team member to price a service with a “50% margin” but they apply a “50% markup” instead, you will end up undercharging your client significantly. To prevent this, you can bookmark and use our specialized tool to Learn more about our margin calculator.
Calculating Gross Profit Margin vs. Net Profit Margin
When analyzing a business—whether it is your own accounting firm or a client’s company—you must look at profitability through multiple lenses. The two most critical metrics are Gross Profit Margin and Net Profit Margin.
Gross Profit Margin
This metric measures how efficiently a company produces its core goods or services. It only takes into account the direct costs associated with delivery (Cost of Goods Sold, or COGS). For an accounting firm, COGS primarily consists of the direct labor costs of the accountants performing the work and any client-specific software licenses.
If your firm brings in $500,000 in annual revenue and your direct delivery costs are $200,000, your gross profit is $300,000, resulting in a 60% gross profit margin.
Net Profit Margin
This is the ultimate measure of overall business health. It accounts for all expenses incurred by the business, including indirect overhead (rent, marketing, administrative salaries, insurance, utilities) as well as interest payments and taxes.
Using the same firm as above: if your direct costs are $200,000, but your office rent, admin staff, marketing, and taxes total another $220,000, your total expenses are $420,000. Your net profit is $80,000, which leaves you with a 16% net profit margin.
While a 60% gross margin looks fantastic, the 16% net margin tells the true story of your firm’s take-home profitability.
The Critical Difference Between Margin and Markup
Let’s dive deeper into why the margin vs. markup distinction matters so much for pricing.
Markup is calculated as a percentage of your costs. It tells you how much to add to your cost to find your final selling price. Margin, on the other hand, is calculated as a percentage of your sales revenue. It tells you how much of every dollar a client pays you actually ends up in your pocket.
Consider this scenario: A boutique consulting client asks you to help them price a new software-as-a-service (SaaS) add-on. The direct cost to host and support the user is $50 per month. The client says, “We want to make a 40% profit margin on this.”
If you mistakenly apply a 40% markup instead of a 40% margin, here is what happens:
- The Markup Calculation: $50 cost + ($50 × 40%) = $70 selling price.
- The Actual Margin Achieved: ($20 profit / $70 selling price) × 100 = 28.57% margin.
By confusing markup with margin, you just cost your client over 11% in profit margin! To get the 40% margin they actually asked for, you must use the margin-to-price formula:
To avoid doing this manual math on the fly, you can instantly swap between these metrics using our free tool to Convert markup to margin.
Advanced Advisory: Break-Even Analysis and Client Forecasting
As strategic advisors, we can leverage our understanding of margins to provide massive value to our clients.
By using a margin calculator for accountants during client advisory sessions, we can help business owners run break-even analyses, evaluate their unit economics, and build accurate financial forecasts.
The break-even point is the exact moment a business’s sales cover all of its operating expenses. To calculate this for a client, we must separate their costs into fixed costs (rent, salaries, insurance) and variable costs (materials, direct labor per unit).
The formula for break-even units is:
The difference between the price per unit and the variable cost per unit is known as the contribution margin. By showing clients how small adjustments to their margins can dramatically lower their break-even point, you position yourself as an indispensable business partner. To run these advanced calculations with ease, you can Explore our omni margin calculator.
Integrating a Margin Calculator for Accountants with Time-Tracking Tools
For service-based businesses like accounting firms, law offices, and creative agencies, time is our primary cost. Therefore, accurate margin calculations are entirely dependent on accurate time tracking.
If your team isn’t tracking their billable and non-billable hours precisely, your COGS figures will be incorrect, rendering your margin calculations useless. By integrating your margin calculator workflows with robust time-tracking and accounting platforms like Harvest, QuickBooks, or Xero, you gain real-time visibility into project profitability.
For example, when you sync time-tracking data with QuickBooks, you can instantly see the exact labor cost of a specific client engagement. If the system shows that a client on a $500 monthly bookkeeping retainer required 12 hours of staff time (at a fully loaded cost of $45/hour), your cost for that month was $540.
Your margin is actually -8%. Armed with this data, you can confidently approach the client for a scope adjustment or a rate increase.
Benchmarking Healthy Profit Margins Across Industries
When advising clients, having access to reliable industry benchmarks is key. A “good” margin in one industry might represent bankruptcy in another. Here is a look at typical gross and net margin benchmarks across several major US sectors in 2026:
- Software & SaaS: Gross margins are incredibly high, typically ranging from 70% to 90%, because the cost to replicate and distribute software is minimal. However, net margins are often lower (10% to 20%) due to massive sales and marketing expenses.
- Professional Services (Accounting, Legal, Consulting): These firms usually target gross margins of 50% to 75% and healthy net margins of 15% to 30%.
- Retail & Apparel: Gross margins typically hover between 40% and 60%, but high overhead costs (rent, retail staff, inventory holding costs) compress net margins down to 5% to 10%.
- Restaurants: Food and labor costs are notoriously high. Gross food margins are usually around 65% to 72% (meaning food costs are 28% to 35%), but net margins are razor-thin, typically averaging just 3% to 12%.
- Grocery Stores: Operating on a high-volume, low-margin model, grocers see gross margins of 20% to 30% but net margins of only 2% to 5%.
By comparing your client’s calculated margins against these industry standards, you can quickly identify whether their primary issue is high production costs (low gross margin) or excessive overhead (healthy gross margin but low net margin).
Frequently Asked Questions about Profit Margins
What is a healthy net profit margin for an accounting client?
While it varies by industry, a general rule of thumb across the US business landscape is that a net profit margin below 5% is low, a margin around 10% is healthy, and any margin above 20% indicates strong performance.
For professional service clients, you should actively push them to optimize their operations to cross that 20% net margin threshold.
What are the most common mistakes accountants make when calculating margins?
Some of the most frequent errors we observe include:
- Confusing Margin and Markup: As detailed above, pricing based on markup percentages instead of margin targets leads to severe underpricing.
- Neglecting Seasonal Fluctuations: Many businesses have highly seasonal revenue cycles. Calculating margins based on a single high-performing month can lead to unrealistic annual forecasts.
- Ignoring Depreciation and Amortization: For asset-heavy clients, failing to account for the depreciation of equipment will artificially inflate their perceived net margins.
- Incorrect Expense Categorization: Mixing up direct delivery costs (COGS) with general overhead (OPEX) will distort your gross margin calculations, making it difficult to analyze core operational efficiency.
How does inflation affect a business’s profit margins?
Inflation acts as a silent margin killer. When the cost of raw materials, labor, and utilities rises, a business’s COGS increases. If the business maintains its current selling prices, its profit margins will automatically shrink.
To combat this, we must advise our clients to regularly run their numbers through a margin calculator and implement strategic, incremental price adjustments to preserve their bottom-line profitability.
Conclusion
Mastering your margins is not just about survival—it is the key to unlocking sustainable, strategic growth for your firm and your clients. By moving away from pricing structures built on guesswork and adopting a precise, data-driven approach, you can stop undercharging for your invaluable expertise.
At ContentVibee, we are dedicated to providing American accounting professionals and business owners with the exact tools and financial insights they need to thrive. Ready to take control of your firm’s financial future? Optimize your firm’s profitability today by exploring our complete suite of financial resources at our tools directory.
For those managing client investment portfolios or specialized accounts, you can also cross-reference margin requirements using tools like the Interactive Brokers Stock Margin Calculator to ensure your overall advisory approach remains completely aligned and regulatory compliant. Let’s build a more profitable future, one calculated decision at a time!


