


Is Your E-Commerce Store Actually Profitable? Here’s How to Know Fast
e commerce business profit or loss is one of the most misunderstood financial realities facing online sellers today — especially those who see strong sales numbers but still feel like money is disappearing.
Here’s the quick answer most sellers need:
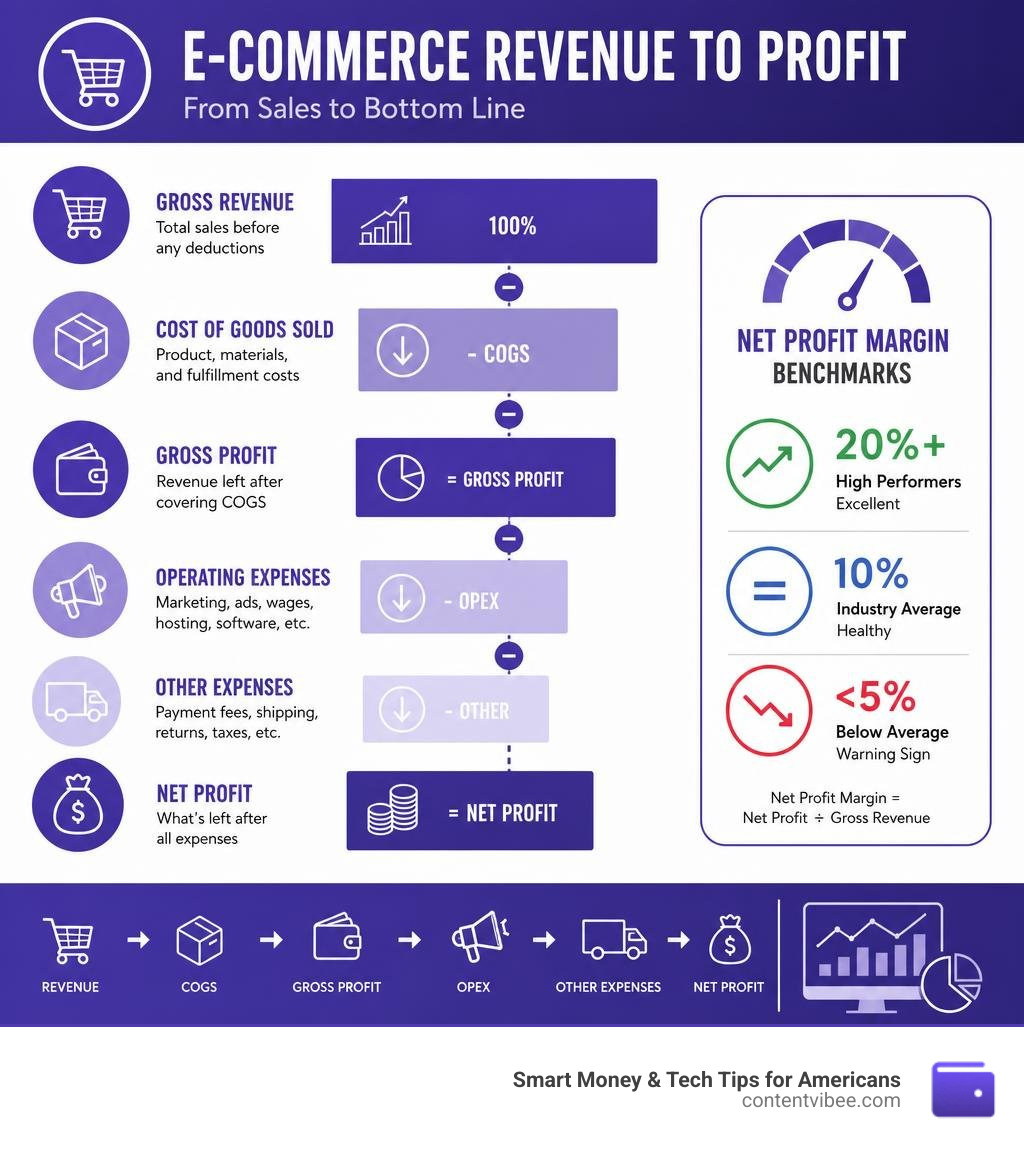
Your e-commerce business is profitable when your net income is positive after subtracting all costs from revenue. The four key numbers to check right now:
- Gross Revenue – Total sales before any deductions
- Gross Profit – Revenue minus the cost of goods sold (COGS)
- Net Operating Income – Gross profit minus operating expenses (ads, hosting, wages)
- Net Profit – What’s left after everything, including fees, shipping, returns, and taxes
The average net profit margin for e-commerce brands is around 10%. High performers hit 20% or more. Below 5% is a warning sign.
Global e-commerce sales are expected to grow from $6.42 trillion in 2025 to $7.89 trillion by 2028. But here’s the uncomfortable truth: revenue growth does not equal profitable growth. Many sellers are scaling their sales and scaling their losses at the same time — without realizing it until it’s too late.
The problem isn’t just revenues. It’s costs — hidden ones, misclassified ones, and ones that never show up on a basic dashboard.
This guide will help you read and use your P&L statement to find out exactly where your money is going.
What is an E-commerce P&L Statement and Why Does It Matter?
A Profit and Loss (P&L) statement—also known as an income statement—is the absolute heartbeat of your online store. While a balance sheet shows your brand’s financial health at a single, static point in time, the P&L statement tracks your financial performance over a specific period (such as a month, quarter, or year). It summarizes your revenues, costs, and expenses to show whether your business is actually generating cash or quietly draining your bank account.
For e-commerce founders, relying solely on your Shopify or Amazon dashboard is a dangerous game. Those dashboards display vanity metrics like gross sales, but they do not account for real-world expenses like storage, payment processing, or return logistics.
A structured P&L statement matters because it gives you a clear window into your day-to-day operations. It tells you if your pricing strategy is sustainable, if your marketing spend is generating a real return, and how much cash you can safely reinvest in inventory or pay yourself.
Furthermore, if you ever plan to seek outside funding, secure a business loan, or sell your brand, investors and lenders will demand to see clean, professionally prepared P&L statements. For a complete look at how to structure these reports, check out this comprehensive Financial Reporting for Ecommerce Founders Guide.
Key Sections of an E-commerce Income Statement
An e-commerce P&L statement is structured differently than a traditional brick-and-mortar or service-based income statement. To get an accurate picture of your e commerce business profit or loss, your chart of accounts must be organized into distinct, logical sections:
- Gross Sales / Revenue: This is the total amount of money collected from customers before any discounts, refunds, or fees are deducted.
- Cost of Goods Sold (COGS): This includes the direct costs of producing or purchasing the items you sell. For e-commerce, this should include the manufacturer’s invoice price, inbound freight, customs duties, and direct packaging materials.
- Gross Profit: Calculated as Gross Sales minus COGS. This measures your core product margin before overhead.
- Operating Expenses (OpEx): These are the costs required to keep the lights on. They include advertising and marketing spend, website hosting, software subscriptions, payroll, and warehouse rent.
- Transaction and Platform Fees: Many standard accounting templates lump merchant fees and platform commissions into general expenses. In e-commerce, fees from Shopify, Amazon, PayPal, and credit card processors should be clearly isolated to measure their true impact on your unit economics.
- Net Income: The final “bottom line” representing your true profit or loss after subtracting all operating expenses, interest, and taxes.
To see how these sections look in a live business, you can review this interactive E-Commerce Management Accounts Demo.
How to Calculate Your E-commerce Business Profit or Loss
To accurately calculate your true profitability, you must move away from simple cash-in, cash-out tracking and adopt a disciplined accrual accounting method. This means matching your expenses to the exact period when the associated revenue was earned.

Without this matching principle, your numbers will swing wildly. For example, if you spend $20,000 on inventory in July but don’t sell those products until September, a cash-based system will show a massive loss in July and an artificially high profit in September.
To simplify your pricing and cost modeling, you can use a dedicated Ecommerce Profit Calculator to test different cost scenarios and determine your optimal pricing structure.
Calculating Gross Profit and Net Operating Income
Let’s break down the mathematical formulas required to understand your profitability.
First, we calculate Gross Profit:
Gross Profit = Net Sales - Cost of Goods Sold (COGS)
Next, we look at Net Operating Income (often referred to as Operating Profit):
Net Operating Income = Gross Profit - Operating Expenses (OpEx)
To see how this works in practice, let’s look at a typical month for an online apparel brand:
- Gross Sales: $100,000
- Refunds & Discounts: $10,000
- Net Sales: $90,000
- COGS (Product cost + inbound shipping): $35,000
- Gross Profit: $55,000 (61.1% Gross Margin)
- Operating Expenses (Ads, Shopify fees, fulfillment, software): $40,000
- Net Operating Income: $15,000 (16.6% Net Operating Margin)
Understanding these margins is critical because it directly feeds into your break-even point. If you don’t map out every variable cost—including packaging, return allowances, and payment processing—your projected break-even point will be completely wrong. For a deep dive into the math behind finding your true financial turning point, read this guide on break-even math analysis.
The Real-Time Advantage in Tracking E-commerce Business Profit or Loss
Traditional accounting relies on “periodic reporting,” meaning you receive your financial statements 10 to 15 days after the month ends. In the world of digital marketing and shifting ad algorithms, waiting weeks to find out if you were profitable is a recipe for disaster.
By utilizing modern real-time tracking, you can connect your marketing data directly to your financial reporting. In e-commerce, traffic spend shouldn’t just be viewed as a fixed overhead expense; it is a highly variable cost of revenue that scales directly with your sales.
When you calculate your sales using the core e-commerce formula:
Traffic x Conversion Rate x Average Order Value (AOV) = Sales
You can immediately subtract your real-time Cost of Goods and your live ad spend (CPA%) to calculate your Ecommerce Gross Profit in real-time. This allows you to spot underperforming campaigns, rising acquisition costs, or inventory issues before they drain your cash reserves. To learn more about this real-time accounting framework, read the whitepaper on the Real Time Calculation of Ecommerce Sales, Margins & Net Profit.
Common Mistakes in E-commerce Financial Reporting
Because e-commerce involves thousands of micro-transactions, automated payouts, and complex inventory cycles, financial reporting errors are incredibly common.

The most frequent mistake we see is incorrect revenue recording. Many founders simply record the net cash deposit from Shopify or Amazon into their bank account as their revenue. This is a massive error.
If Amazon deposits $10,000 into your account, that deposit is already net of referral fees, storage fees, refunds, and advertising costs. By recording only the net deposit, you are completely hiding your true sales volume and your actual operating expenses, making it impossible to optimize your margins.
Other common mistakes include:
- An incomplete chart of accounts that fails to separate platform fees from shipping costs.
- Inaccurate COGS tracking, such as using the “best price ever paid” rather than a weighted average of actual purchase orders.
- Treating inventory as an immediate expense instead of holding it as an asset on the balance sheet until the moment it is sold.
To avoid these pitfalls, utilizing dedicated e-commerce tools to automate your data integration is highly recommended.
Hidden Costs That Distort Your E-commerce Business Profit or Loss
The gap between a brand’s “dashboard margin” and its “bank account margin” is almost always caused by hidden costs. Commerce platforms design their dashboards to highlight sales growth, often leaving these critical expenses out of the main view:
- Payment Processing Fees: While the headline rate might be 2.9% + $0.30, the real-world cost for brands with international customers, chargebacks, and currency conversions often ranges from 3.6% to 4.2%.
- Shipping as a Silent Loss Leader: Offering free shipping is a highly effective conversion tool, but if your packaging costs and carrier rates inflate, a $9 shipping cost on a $30 order can instantly destroy your margins.
- Return Processing and Reverse Logistics: When a customer returns an item, you don’t just lose the sale. You also lose the original shipping cost, pay a return processing fee, and incur a restocking charge of $3 to $7 per unit.
- Chargebacks: Credit card disputes cost $15 to $25 per incident, even if you win the dispute, plus the lost cost of the inventory.
- Packaging Material Inflation: Mailers, custom boxes, tissue paper, and void fill have risen 8% to 15% in cost over the past two years.
To see how these sneaky expenses compound over time, read this detailed breakdown on Shopify Profit Margin Hidden Costs.
Benchmarks: What is a Healthy Profit Margin in 2026?
What constitutes a “good” margin depends heavily on your product category, your sales channels, and your business model. Below are realistic 2026 e-commerce benchmarks representing median and top-performing brands after accounting for all real-world costs:
| Category | Median Gross Margin | Median Net Margin | Top 25% Net Margin | Typical Return Rate |
|---|---|---|---|---|
| Apparel & Fashion | 55% – 75% | 8% | 18% | 20% – 30% |
| Cosmetics & Beauty | 60% – 80% | 15% | 22% | 2% – 5% |
| Supplements & Health | 60% – 80% | 12% | 25% | 2% – 5% |
| Home & Kitchen | 45% – 65% | 8% | 14% | 5% – 8% |
| Electronics & Gadgets | 20% – 40% | 5% | 8% | 8% – 12% |
| Food & Consumables | 30% – 50% | 7% | 10% | 2% – 5% |
As you can see, a supplement brand can easily remain highly profitable with a 12% net margin, whereas an electronics brand operating on thin gross margins must maintain incredibly tight operational control just to stay in the black. For a deeper look at these industry benchmarks, explore the latest e-commerce profit benchmarks.
Profitable Business Models for Beginners
If you are just starting out, choosing the right business model will dictate your startup costs, operational complexity, and profit potential:
- Digital Products: Ebooks, templates, online courses, and software boast the highest margins in e-commerce—often up to 90% net profit—because there are no physical inventory or shipping costs.
- Print-on-Demand (POD): Excellent for beginners due to zero upfront inventory costs. However, because the supplier handles printing and fulfillment on a per-unit basis, your gross margins will be lower (typically 30% to 40%).
- Dropshipping: Low barrier to entry and minimal startup capital required. The main challenge is highly competitive markets and thin net margins (often 5% to 10%) due to rising ad costs and lack of supply chain control.
- Subscription Boxes: Provides highly predictable monthly recurring revenue (MRR). The key to profitability here is managing the customer churn rate and optimizing your packaging and shipping costs.
To learn how to structure these models for long-term financial success, read about the Formula For A Profitable Ecommerce Business.
Actionable Strategies to Improve Your Profit Margins
If your financial analysis reveals that your store is burning cash, you don’t necessarily need to acquire more customers. Instead, you need to optimize the business you already have.
Here are the most effective levers you can pull to immediately improve your profit margins:
- Implement Pricing Experiments: Don’t be afraid to test price increases. Raising your prices by just 5% to 10% on your top-performing SKUs can boost your net profits significantly, even if you experience a minor drop in overall sales volume.
- Negotiate with Your Suppliers: Don’t just accept the first wholesale price you are given. Share a rolling 12-month production plan with your manufacturer. By committing to consistent reorder volumes, you can often negotiate a 5% to 8% reduction in product COGS or secure better payment terms to free up working capital.
- Increase Average Order Value (AOV): It costs the exact same amount of ad spend to acquire a customer who spends $30 as it does to acquire one who spends $60. Implement post-purchase upsells, product recommendations, and smart bundles to encourage larger cart sizes.
- Optimize Your Inventory Planning: Stockouts cost brands an estimated $1 trillion annually in lost revenue, while carrying too much “dead stock” costs an average of 30% more than the inventory’s actual value due to storage and capital costs. Use bottom-up forecasting based on supplier lead times to keep your inventory lean and efficient.

Frequently Asked Questions about E-commerce Profitability
What is a good net profit margin for an e-commerce store?
For most independent direct-to-consumer (DTC) brands, a healthy net profit margin sits between 10% and 20% after all costs are deducted. A net margin below 5% makes your business highly vulnerable to sudden shifts in ad costs or shipping rates, while a net margin above 20% is considered exceptionally strong.
Why is my e-commerce business losing money despite high sales?
This is almost always due to the “scale trap.” When sales increase, variable expenses like ad spend, merchant fees, shipping labels, packaging, and return processing scale right along with them. If your unit economics are fundamentally flawed—meaning you lose money on the first purchase and fail to retain customers for repeat purchases—growing your sales will only accelerate your losses.
How often should I analyze my e-commerce P&L statement?
You should conduct a formal review of your P&L statement monthly, ideally within 10 to 15 days of the month closing. However, you should also track your key operational metrics—such as ad spend as a percentage of revenue, conversion rates, and average order value—on a weekly or even daily basis to make proactive, real-time adjustments.
Conclusion
At ContentVibee, we understand that managing the financial health of an online business can feel overwhelming. Whether you are navigating complex e-commerce metrics or planning your long-term personal financial security and retirement planning, keeping a close eye on your cash flow is the ultimate key to freedom.
By mastering your P&L statement, identifying hidden costs, and making data-driven pricing decisions, you can transform your online store from a cash-burning hobby into a highly profitable, sustainable asset.
Ready to find out exactly where your business stands? Use our free Ecommerce Profit Calculator right now to map your costs, calculate your true margins, and take complete control of your financial future.


