


Is Your Business Actually Profitable? What the Numbers Really Say
The average profit margin for business varies widely depending on your industry — but most small businesses should aim for a net profit margin between 5% and 10%.
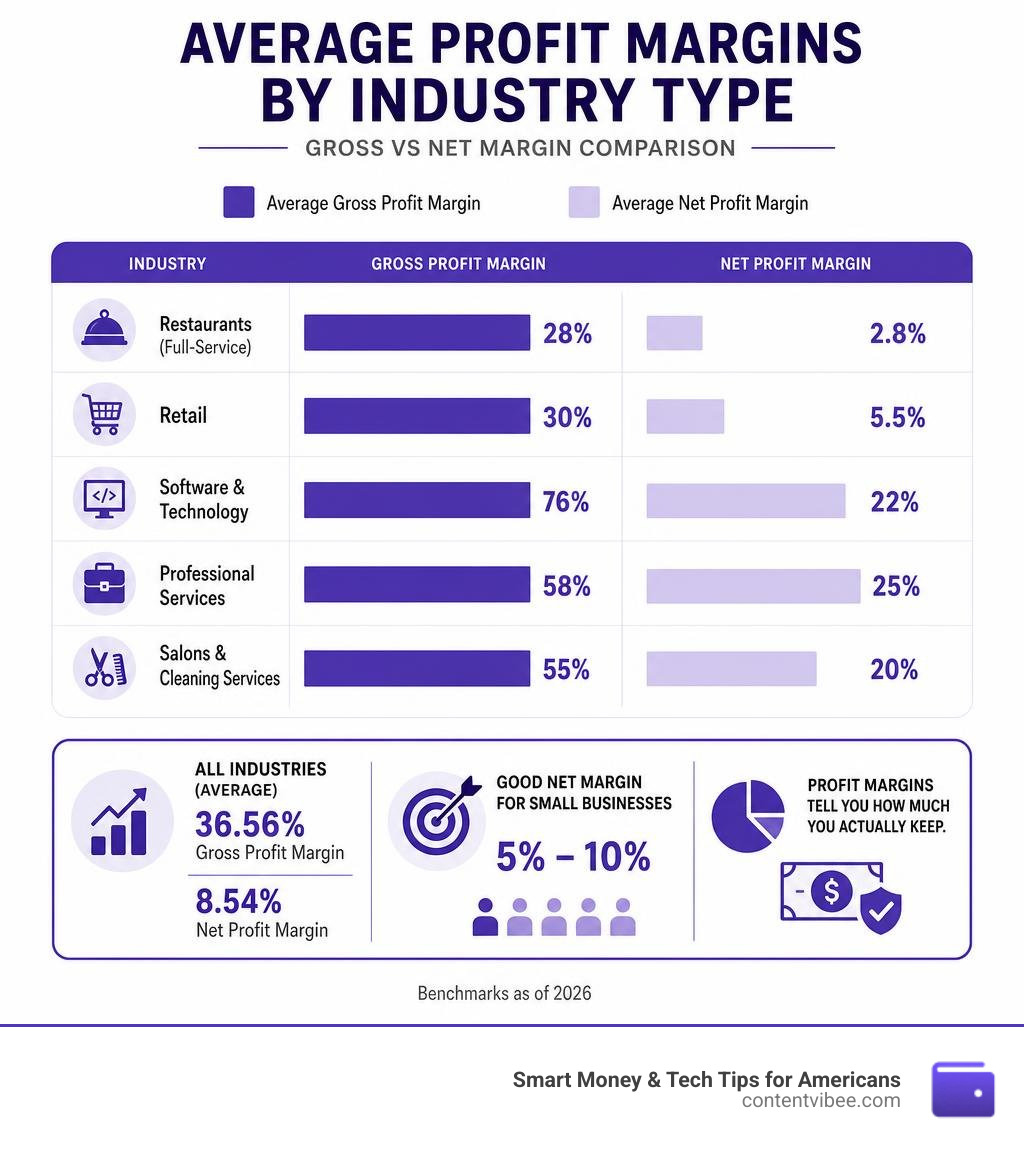
Here’s a quick snapshot of where key benchmarks stand as of 2026:
| Metric | Benchmark |
|---|---|
| Average gross profit margin (all industries) | 36.56% |
| Average net profit margin (all industries) | 8.54% |
| Good net margin for small businesses | 5% – 10% |
| Restaurants (full-service) | ~2.8% net |
| Retail | 3% – 8% net |
| Software and technology | 19% – 25% net |
| Professional services | 15% – 35% net |
| Salons and cleaning services | 10% – 31% net |
Most business owners focus on revenue. Big mistake.
A business pulling in $2 million a year can still be in financial trouble if margins are razor-thin. Revenue tells you how much money is coming in. Profit margin tells you how much you actually keep.
And that difference matters enormously — especially if you’re a pre-retiree or retiree counting on your business income to stay ahead of taxes, fund distributions, or support a comfortable retirement lifestyle.
Here’s the hard truth: nearly 40% of small business owners don’t regularly track their margins against industry benchmarks. That means they have no idea whether their business is performing well or quietly bleeding money.
This guide will change that. You’ll learn exactly what profit margins mean, how your numbers compare to real industry averages, and what levers you can pull to protect and grow what you keep.
Understanding Profit Margins: Gross, Operating, Net, and EBITDA
To accurately assess your business health, you must look beyond a single “profit” figure. Profitability is a multi-layered concept. By breaking down your income statement into distinct margin types, you can pin down exactly where your money is going.
If you are new to these concepts, we recommend starting with our guide on The Easiest Way to Calculate Profit Margin to build a solid foundation.
Why Knowing the Average Profit Margin for Business Matters
If you do not know the standard benchmarks for your sector, you are operating in the dark. Benchmarking your margins allows for smarter strategic planning, improves investor relations, and keeps cash flow management predictable. Furthermore, if you plan to sell your company to fund your retirement, your business valuation will depend heavily on these margin percentages rather than raw revenue alone.
Gross Profit Margin
Gross profit margin measures your profitability after accounting only for the direct costs of producing your goods or services. These direct costs are known as the Cost of Goods Sold (COGS).
- The Formula:
Gross Profit Margin = ((Revenue - COGS) / Revenue) * 100
This metric highlights your pricing power and manufacturing efficiency. If your gross margin is too low, you cannot cover your overhead, no matter how much you scale. To dive deeper into managing these direct production expenses, check out our guide on Gross Margin Cost Demystified for Small Businesses.
Operating Profit Margin
Operating profit margin takes your analysis a step further by subtracting your daily operating expenses. These include selling, general, and administrative (SG&A) expenses, rent, utilities, marketing, and payroll. It reflects your true operational efficiency before financial structures and government taxes enter the equation.
- The Formula:
Operating Profit Margin = (Operating Income / Revenue) * 100
Net Profit Margin
This is the ultimate bottom-line profitability metric. Net profit margin is what remains after subtracting all expenses, including operating costs, interest payments, taxes, depreciation, and amortization. It is the most comprehensive measure of overall business health.
- The Formula:
Net Profit Margin = (Net Income / Revenue) * 100
EBITDA Margin
EBITDA stands for Earnings Before Interest, Taxes, Depreciation, and Amortization. Lenders and business buyers favor the EBITDA margin because it strips out the effects of different capital structures, tax jurisdictions, and non-cash accounting expenses like depreciation. This makes it much easier to compare the core profitability of two businesses in the same industry.
What is the Average Profit Margin for Business Across Industries?

When evaluating your performance, you must compare your business to its specific sector. A “good” margin in one industry would spell financial ruin in another. According to extensive financial datasets, such as the NYU Stern database on Operating and Net Margins, profit margins vary dramatically across the U.S. economy.
High-Margin Sectors: Software, Finance, and Professional Services
High-margin industries typically feature low variable costs, high barriers to entry, strong brand recognition, and robust intellectual property protections.
- Software & B2B SaaS: Technology businesses maintain exceptional margins, with gross margins often exceeding 70% and net margins settling between 19% and 25%. This is due to low marginal costs—once the software is built, replicating it for another customer costs next to nothing.
- Financial Services: Banks and asset managers dominate high-margin rankings. According to Industry Benchmarks of Gross, Net and Operating Profit Margins – Vena, “Money Center” banks achieve an average gross margin of 100% and a net margin of 30.89% due to their unique deposit-to-loan business model. Regional banks follow closely with a 99.8% gross margin, while diversified banks average 98.1%.
- Professional Services: Law firms, accounting practices, and top-tier consulting firms regularly exceed 15% to 35% net margins because their primary input is human expertise rather than expensive physical inventory.
Low-Margin Sectors: Retail, Restaurants, and Manufacturing
Low-margin sectors are characterized by intense competition, high capital requirements, heavy inventory costs, and complex supply chains.
- Grocery Stores & General Retail: Grocery stores operate on razor-thin net margins of 1% to 3% (averaging around 1.32% to 1.96%). They rely on high sales volume to survive. General brick-and-mortar retail averages modest net margins of 2% to 6%.
- Restaurants & Food Service: Full-service restaurants face high overhead and food spoilage, resulting in average net margins of just 2.8% to 4%.
- Heavy Manufacturing & Commodities: Industries like automotive manufacturing and steel production require massive upfront capital. The auto and truck industry has one of the lowest average gross margins at 12.45% and net margins around 1.29% to 3.53%. Meanwhile, the Steel industry averages a 12.6% gross margin, and Paper & Paper Products sit at a low 8% gross margin.
- Real Estate Development: Due to high debt service, cyclical market shifts, and immense construction costs, real estate development actually averaged a negative net profit margin of -16.35% in recent datasets, despite maintaining a positive gross margin of 32.20%.
Average Gross and Net Profit Margins Across Major US Industries
To help you compare these benchmarks, the table below highlights key U.S. industry sectors using data compiled from Profit margin by industry, gross and net … and other academic financial databases for 2026.
| Industry Sector | Average Gross Margin | Average Net Margin | Profitability Tier |
|---|---|---|---|
| Banks (Money Center) | 100.00% | 30.89% | Very High |
| Software (System & Application) | 71.52% | 25.49% | High |
| Precious Metals | 60.00% | 28.59% | High |
| Drugs (Pharmaceutical) | 65.26% | 15.20% | Medium-High |
| Professional Services | ~50.00% | 15.00% – 35.00% | Medium-High |
| Apparel Retail | 51.93% | 3.15% | Low-Medium |
| Farming & Agriculture | 16.49% | 7.12% | Low-Medium |
| Restaurants & Dining | ~32.00% | 2.80% – 4.00% | Low |
| Steel | 12.60% | 3.20% | Low |
| Auto & Truck Manufacturing | 12.45% | 1.29% | Low |
| Retail (Grocery & Food) | ~15.00% | 1.32% | Low |
| Real Estate (Development) | 32.20% | -16.35% | Negative |
Key Factors That Influence Your Business Profit Margins

Understanding why margins differ is the first step toward fixing yours. Several internal and external forces dictate how much of each dollar you get to keep.
Labor Costs and Staffing Efficiency
Labor is often the single largest expense on a business’s profit and loss statement, typically eating up 30% to 37% of revenue for restaurants and service companies.
- The Margin Squeeze: In food services, the difference between a highly profitable restaurant and an unprofitable one is often just an 8.7 percentage point difference in labor costs (profitable operations keep labor at 34.2% of sales, while unprofitable ones let it climb to 42.9%).
- The Solo Advantage: According to 2026 small business data, nonemployer (solo) businesses achieve an average net margin of 35.7% because the owner substitutes their own labor for paid staff. Once a business hires its first 1 to 4 employees, average net margins drop to 12.3% due to payroll taxes, benefits, and management overhead.
Pricing Strategy and Competitive Pressure
Underpricing is one of the most common margin killers for small businesses. Many owners eyeball their prices or copy competitors without calculating their true operational overhead. If you operate in a highly competitive market, you lose pricing power and are forced to accept lower margins to survive.
Overhead and Fixed Operating Expenses
Fixed overhead—such as commercial rent, software subscriptions, insurance, and debt service—remains the same regardless of your sales volume. If your sales decline, these fixed costs consume a larger percentage of your revenue, shrinking your net margins.
Economic Conditions and Business Lifecycle
Inflationary pressures raise the cost of raw materials and labor. If you cannot pass these cost increases onto your customers, your margins will contract.
Interestingly, business size also plays a major role: profitability benchmarks show that profit margins peak at an average of 11.4% for businesses with $1 million to $5 million in annual revenue. Beyond that “sweet spot,” margins often decline temporarily as businesses must invest heavily in middle management, larger facilities, and complex enterprise software to scale.
How to Benchmark and Measure Your Profitability
To get an accurate picture of where your business stands, you must benchmark your performance against businesses of similar size, model, and geography. Comparing a boutique local accounting firm to a multinational conglomerate will yield useless data.
For a detailed analysis of net margins across dozens of sectors, review the Net Profit Margin by Industry Benchmarks (2026) | CalcMastery.
How to Benchmark Your Average Profit Margin for Business
- Analyze Public and Private Databases: Use resources like SEC filing data from Industry Ratios (benchmarking): Profit margin to see public company performance, and IRS sole proprietorship data to see private benchmarks.
- Look at Local Competitors: National averages can be skewed by massive corporations. Seek out regional business groups or local financial benchmarks to understand what is normal in your specific city.
- Track Historical Trends: Compare your current 2026 margins against your performance from previous years. Are your margins expanding as you grow, or are you experiencing “diseconomies of scale”?
Avoiding Common Benchmarking Mistakes
When comparing your metrics to industry averages, watch out for these common analytical traps:
- Ignoring Capital Structure: A business with heavy debt will show lower net margins due to interest expenses, even if its core operations are highly profitable. Use EBITDA to compare operational efficiency.
- Treating One-Year Margins as Normal: Cyclical industries (like construction, metals, or agriculture) can have highly volatile margins. Always look at a 3-to-5-year average.
- Revenue Recognition Differences: Ensure you and your benchmarks use the same accounting standards (cash vs. accrual basis).
- Ignoring Tax Structures: A sole proprietorship, an S-Corp, and a C-Corp handle taxes differently, which significantly impacts reported net income.
Actionable Strategies to Improve and Protect Your Margins
If your benchmarking reveals that your margins are lagging behind the average profit margin for business in your sector, it is time to take action. You do not have to accept low profitability as an unchangeable reality.
For those tracking these metrics in spreadsheets, our guide on Stop Eyeballing It Excel Add Margin Formulas Made Easy can help you build automated tools to monitor your progress.
Optimizing Cost Structures and Supplier Contracts
- Negotiate with Vendors: Do not simply accept annual price increases. Consolidate your purchases with fewer suppliers to leverage bulk purchasing discounts.
- Improve Inventory Turnover: Carrying excess inventory ties up cash and increases warehousing costs. Implement the First-In, First-Out (FIFO) method to reduce spoilage and obsolescence.
- Control Hidden Waste: Track high-cost items daily and conduct regular waste audits.
Leveraging Technology and Automation
- Optimize Scheduling: For labor-heavy businesses, use modern scheduling software to match your staffing levels to real-time customer demand. Tracking sales per labor hour prevents overstaffing during slow shifts.
- Streamline Payment Processing: High credit card processing fees can quietly erode 2% to 4% of your gross revenue. Look into modern payment processing solutions that offer lower interchange rates, or consider cash-discount programs.
- Automate Administrative Tasks: Use cloud-based financial platforms, ERP systems, and automated invoicing tools to reduce the hours your team spends on manual data entry.
Shifting Product Mix to Higher-Margin Offerings
Not all revenue is created equal. To maximize your bottom line, you must understand which of your products or services generate the most profit.
- Contribution Margin Analysis: Calculate the margin of safety for each item you sell. To master this financial concept, read The Ultimate Guide to Margin of Safety in Managerial Accounting.
- Promote High-Margin Lines: Focus your marketing budget on your most profitable offerings while phasing out or repricing low-margin, high-effort products.
- Expand Cash-Pay or Value-Add Services: For example, a physical therapy practice can boost its margins by adding cash-pay wellness services, and an e-commerce retailer can calculate exact per-order profitability using our Ecommerce Profit Calculator Calculate Ecommerce Profit.
Frequently Asked Questions About Business Profit Margins
What is considered a good net profit margin for a small business?
Generally, a net profit margin of 5% to 10% is considered average and healthy for most small businesses. A margin of 20% or higher is excellent. However, this is highly dependent on your industry. As detailed in the guide on What is a Good Profit Margin for Small Businesses?, a 5% net margin is outstanding for a grocery store but highly disappointing for a law firm or consulting practice.
Why do software companies have much higher margins than restaurants?
Software companies have high upfront development costs (fixed costs) but incredibly low variable costs. Selling a million additional copies of a software program costs virtually nothing, allowing margins to expand rapidly with scale. Restaurants, on the other hand, have high variable costs (food, beverages, hourly labor) for every single meal they serve, meaning their margins remain tightly constrained even as they grow.
How often should a business owner review their profit margins?
We recommend reviewing your gross margins monthly to catch sudden increases in supplier prices or labor costs. Net margins should be analyzed quarterly to assess overall operational efficiency, while comprehensive pricing audits and competitor benchmarking should be conducted at least once a year.
Conclusion
Understanding and optimizing your average profit margin for business is not just about corporate performance—it is a vital pillar of personal financial freedom.
At ContentVibee, we specialize in personal finance, technology, and retirement planning. For business owners approaching retirement, your business is likely your largest asset. Maximizing your profit margins today directly increases your business valuation, making it far easier to fund your future retirement.
Furthermore, keeping your business highly profitable ensures you have the reliable cash flow needed to navigate complex retirement regulations, such as the SECURE Act 2.0 RMD (Required Minimum Distribution) rules, without being forced to liquidate other personal investments.
Ready to take control of your numbers and stop undercharging? Use our free Tools Margin Calculator to instantly analyze your pricing and protect your bottom line today.
For more targeted calculators, explore our specialized tools:
- Margin Calculator for Accountants Stop Undercharging and Start Multiplying Your Profits
- Tools Margin Calculator Omni Margin Calculator
- Tools Margin Calculator Markup to Margin Calculator
- Browse our complete suite of business resources at our Tools directory.


