


Why Stock Market Brokerage Charges Can Make or Break Your Returns
Stock market brokerage charges are the fees and commissions you pay every time you buy or sell investments — and they can quietly drain your wealth over time.
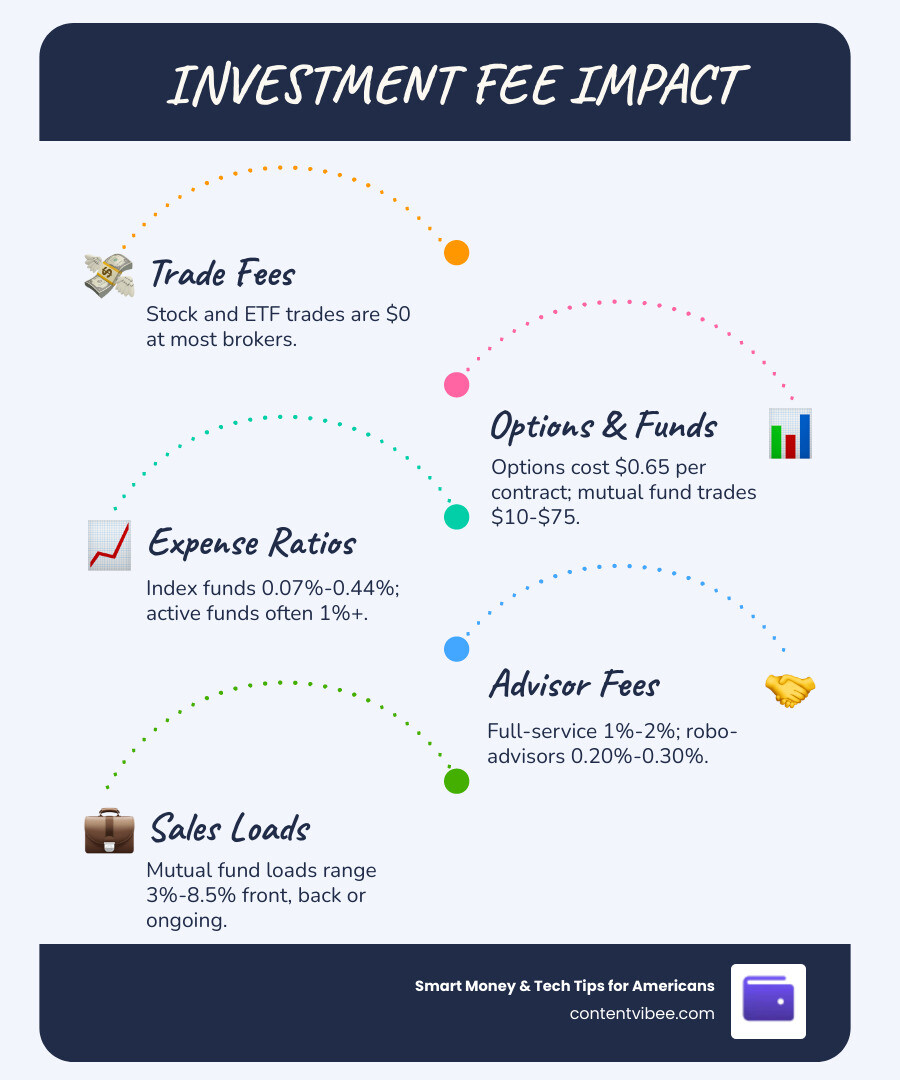
Here’s a quick breakdown of the most common types:
| Fee Type | Typical Cost | When You Pay It |
|---|---|---|
| Online stock/ETF trade | $0 (most major brokers) | Per trade |
| Broker-assisted trade | $25 per trade | When you call for help |
| Options contract fee | ~$0.65 per contract | Per contract traded |
| Mutual fund transaction fee | $10 to $75 | Per buy or sell |
| Expense ratio (index fund) | 0.07% to 0.44% annually | Ongoing, built into fund |
| Expense ratio (active fund) | 1%+ annually | Ongoing, built into fund |
| Full-service advisor fee | 1% to 2% of assets | Annual |
| Robo-advisor fee | 0.20% to 0.30% of assets | Annual |
| Sales load (mutual fund) | 3% to 8.5% | Front, back, or ongoing |
Most investors focus on picking the right stocks or funds. Far fewer pay attention to what they’re paying to hold those investments.
That’s a costly mistake. An investor paying 2% in annual fees on a $500 monthly investment over 30 years could lose roughly $178,000 more to fees than someone in a low-cost alternative. The investment is the same — the fee is the only difference.
This guide explains every major fee category, shows you how so-called “zero-commission” brokers still make money, and gives you practical steps to keep more of what you earn.
Understanding the Primary Types of Stock Market Brokerage Charges

When we talk about stock market brokerage charges, we aren’t just talking about a single line item on your monthly statement. Brokerage fees are the “admission price” for participating in the financial markets. They vary significantly depending on the asset class you are trading—whether it’s stocks, Exchange-Traded Funds (ETFs), or mutual funds.
For many years, the primary cost was the trading commission: a flat fee paid to the broker every time you hit the “buy” or “sell” button. While many online platforms have moved toward a $0 commission model for stocks and ETFs, other assets still carry heavy price tags. Mutual funds, for example, often come with transaction fees ranging from $10 to as much as $75 if the fund isn’t on the broker’s “No-Transaction-Fee” (NTF) list.
Understanding these nuances is essential for Understanding Brokerage Fees and Investment Commissions because what looks like a free trade might actually have costs baked in elsewhere.
One-Time Commissions vs. Ongoing Expense Ratios
It is helpful to think of investment costs in two buckets: the cost to get in (commissions) and the cost to stay in (expense ratios).
A commission is a one-time transaction cost. In contrast, an expense ratio is an ongoing annual fee charged by a mutual fund or ETF to cover management, administration, and marketing. You don’t get a bill for this; the fund simply deducts it from the assets, which reduces your total return.
The difference in these percentages might seem trivial, but the gap between “low-cost” and “industry average” is massive:
- Low-cost index providers: Average expense ratios can be as low as 0.07%.
- Industry average: The typical fund might charge closer to 0.44%.
- Actively managed funds: These often exceed 1.00% as you pay for a human manager to try (and often fail) to beat the market.
By choosing passive management (index funds) over active management, you are essentially giving yourself an immediate raise in your expected annual returns.
How Zero-Fee Stock Market Brokerage Charges Generate Revenue
You’ve likely heard the saying: “If you aren’t paying for the product, you are the product.” This applies perfectly to “zero-commission” brokers. While they don’t charge you a $4.95 commission, they still have light bills to pay and shareholders to satisfy.
So, how do they do it? Here are the primary ways they generate revenue:
- Payment for Order Flow (PFOF): This is the most controversial method. Brokers send your trade orders to market makers who pay the broker a small fee for the privilege of executing the trade. While this allows for $0 commissions, it can sometimes result in slightly less favorable execution prices for the investor.
- Margin Lending: If you borrow money from your broker to buy more stock (trading on margin), they charge you interest. In May 2026, these rates can range from 7% to over 12% depending on your balance.
- Cash Sweep Interest: When you have uninvested cash sitting in your account, brokers “sweep” it into a bank. They earn a higher interest rate on that money than the small amount (if any) they pass back to you.
- Securities Lending: Brokers may lend out the stocks you own to short-sellers, pocketing the fees associated with the loan.
For a deeper look at how these models work, check out our Guide to Transparent Brokerage Charges and Pricing.
Administrative Costs and Specialized Instrument Fees
Beyond the trades themselves, there is a whole ecosystem of “nuisance fees” that can nibble away at your balance. These are often buried deep in the fine print of a 50-page disclosure document.
Common administrative costs include:
- Wire Transfer Fees: Sending money out of your account via wire often costs $25 to $30.
- Account Maintenance Fees: Some brokers still charge $50 to $75 annually just for keeping the account open, though many waive this for balances over $10,000.
- Inactivity Charges: If you don’t trade for a year, some platforms might ding you $50 or more.
- Full Transfer-Out Fees: If you decide to leave your broker and move your assets elsewhere, expect to pay a “parting gift” fee of $75 to $100.
- Paper Statement Surcharges: In our digital age, wanting a physical piece of mail can cost you $2 to $5 per statement.
We always recommend Reviewing Self-Directed Brokerage Fee Schedules before signing up to ensure you aren’t surprised by these “hidden” costs.
Trading Specialized Instruments Like Options and Bonds
If you move beyond basic stocks, the fee structure changes. Options trading usually involves a “per contract” fee. While the base trade might be $0, you’ll typically pay $0.65 per contract. If you trade 10 contracts, that’s $6.50. It adds up quickly for high-volume traders.
Bonds and Certificates of Deposit (CDs) work differently. Often, you aren’t charged a “commission,” but the broker adds a “markup” to the bond’s price. For secondary market corporate bonds, this might be $1 per $1,000 of face value (often capped around $250). When you buy a bond, you’re essentially paying a slightly higher price than the broker paid, and they pocket the difference.
For more details, see our breakdown of Commissions for Stocks and Specialized Instruments.
Mutual Fund Sales Loads and 12B-1 Fees
Mutual funds can be the most expensive neighborhood in the investment world if you aren’t careful. Some funds carry “sales loads,” which are essentially sales commissions paid to the broker or advisor who sold you the fund.
- Front-End Loads: You pay this when you buy. If you invest $5,000 in a fund with a 5% front-end load, only $4,750 actually gets invested.
- Back-End Loads: You pay this when you sell. These often decrease the longer you hold the fund, eventually disappearing after 5-7 years.
- Level Loads: An ongoing annual percentage (often 1%) charged as long as you hold the fund.
- 12B-1 Fees: These are recurring fees (typically 0.25% to 1%) used for “marketing and distribution.” In plain English: you are paying the fund to advertise to other people.
The good news? These are almost entirely avoidable. By sticking to “no-load” funds and ETFs, you can keep these thousands of dollars in your own pocket. This is exactly Why investment fee comparisons matter—the exact same market exposure can cost 10x more depending on the fund’s fee structure.
Comparing Advisory Models: Robo-Advisors vs. Full-Service
How much help do you need? Your answer to that question will determine your stock market brokerage charges more than almost anything else.
Robo-Advisors use algorithms to manage your portfolio. They handle rebalancing and tax-loss harvesting automatically. Because they don’t have to pay for expensive mahogany-row offices or human salaries, they are cheap. Typical fees range from 0.20% to 0.30% of your assets annually.
Full-Service Advisors provide a human touch. They can help with complex estate planning, tax strategies, and emotional coaching during market crashes. However, this comes at a premium. Most full-service brokers charge between 1% and 2% of your managed assets. On a $1 million portfolio, that’s $10,000 to $20,000 every single year.
The key is determining if the “value added” by the human advisor exceeds the cost. If they are just putting you in basic funds you could buy yourself, the fee is hard to justify. If they are saving you from a $50,000 tax mistake, they are worth every penny. For more on this, explore Understanding Advisory Fees and Value.
Strategies to Minimize Your Stock Market Brokerage Charges
Minimizing fees isn’t just about being frugal; it’s about mathematical necessity. Over 30 years, the “fee drag” can be the difference between a comfortable retirement and having to work an extra five years.
| Feature | Low-Fee Strategy | High-Fee Pitfall |
|---|---|---|
| Statements | E-delivery (Free) | Paper Statements ($2-$5 each) |
| Fund Type | Index ETFs/No-Load Funds | Load Mutual Funds (3-8% fee) |
| Trade Method | Online Self-Directed ($0) | Broker-Assisted ($25+) |
| Account Type | No-fee Discount Broker | Full-service with maintenance fees |
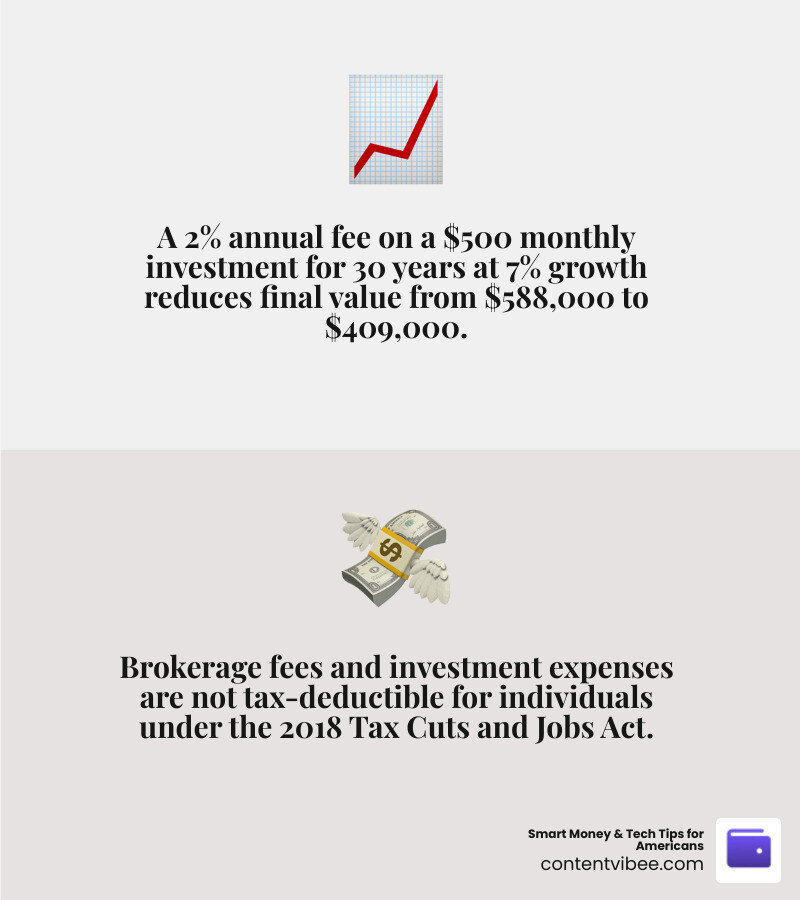
One important note for 2026: Brokerage fees are currently NOT tax-deductible. Since the Tax Cuts and Jobs Act of 2017, miscellaneous itemized deductions (which included investment fees) were suspended. This makes it even more vital to reduce them, as you are paying them with “after-tax” dollars.
To see how these charges differ across providers, check out Brokerage Charges and Pricing for US Stocks.
Reducing Your Total Stock Market Brokerage Charges Through Tech
We are big fans of using technology to cut costs. Here are three actionable steps:
- Automate Rebalancing: Use platforms that automatically rebalance your portfolio using new contributions. This avoids the transaction costs (and potential taxes) of selling one asset to buy another.
- Watch the “Early Redemption” Clock: Many brokers charge a “short-term redemption fee” (often $50) if you sell a mutual fund within 60 days of buying it. Use tech alerts to ensure you’ve held a position long enough to avoid the penalty.
- Consolidate for Waivers: Many brokers offer “Tiered” benefits. If you move your IRA, taxable account, and spouse’s account to one place, you might hit a balance threshold (like $100k or $250k) that waives all administrative fees and gives you free access to premium research.
Frequently Asked Questions about Brokerage Fees
Are brokerage fees and investment expenses currently tax-deductible?
No. Under current tax laws in May 2026 (following the 2018 Tax Cuts and Jobs Act), individual investors cannot deduct brokerage fees, custodial fees, or investment advisory fees on their federal tax returns. This makes low-cost investing even more critical for your “bottom line” returns.
What is the difference between a front-end and back-end sales load?
A front-end load is a commission deducted from your initial investment (you pay to get in). A back-end load (or Contingent Deferred Sales Charge) is a fee paid when you sell the fund (you pay to get out). Back-end loads often “age out,” meaning the percentage drops for every year you hold the investment until it eventually hits zero.
How do small percentage-based fees impact a portfolio over 30 years?
They compound just like your gains do, but in reverse. If you invest $500 a month for 30 years and earn 7% annually, you’d have about $588,000 with 0% fees. If you pay 2% in annual fees (reducing your net return to 5%), you’d end up with roughly $409,000. That 2% fee cost you $179,000 of your potential wealth.
Conclusion
At Smart Money & Tech Tips for Americans, we believe that the most successful investors aren’t necessarily those who find the “next big stock,” but those who are the best at managing what they can control: their costs.
The trend of “fee compression” has been a gift to investors, but it has also made the remaining fees more “hidden” than ever. Whether you are trading from a high-rise in San Francisco or a home office in San Diego, the rules of the game are the same: every dollar you pay in stock market brokerage charges is a dollar that isn’t compounding for your future.
As we look at the market in May 2026, the tools to invest for near-zero cost have never been better. By opting for e-delivery, choosing low-cost ETFs, and avoiding “loaded” funds, you can ensure that the lion’s share of market returns stays exactly where it belongs—in your account.
Learn more about smart investment strategies and start auditing your statements today. Your future self will thank you for the thousands of dollars you saved.