


Why an Expense Ratio Impact Calculator Could Be the Most Important Tool in Your Portfolio
An expense ratio impact calculator is one of the most powerful — and most overlooked — tools available to everyday investors. If you have money in a mutual fund or ETF right now, fees are quietly being deducted from your account every single day. Most people never notice. But over 10, 20, or 30 years, those small percentages can cost you hundreds of thousands of dollars.
Quick Answer: What Does an Expense Ratio Impact Calculator Show You?
| What You Input | What You Learn |
|---|---|
| Initial investment amount | How much your money grows before fees |
| Annual or monthly contributions | How much your money grows after fees |
| Expected annual return (e.g., 8%) | The total dollar difference between a low-fee and high-fee fund |
| Time horizon (e.g., 30 years) | How many years of retirement income fees are costing you |
| Expense ratio (e.g., 0.03% vs. 1.00%) | The exact “wealth gap” created by the fee difference |
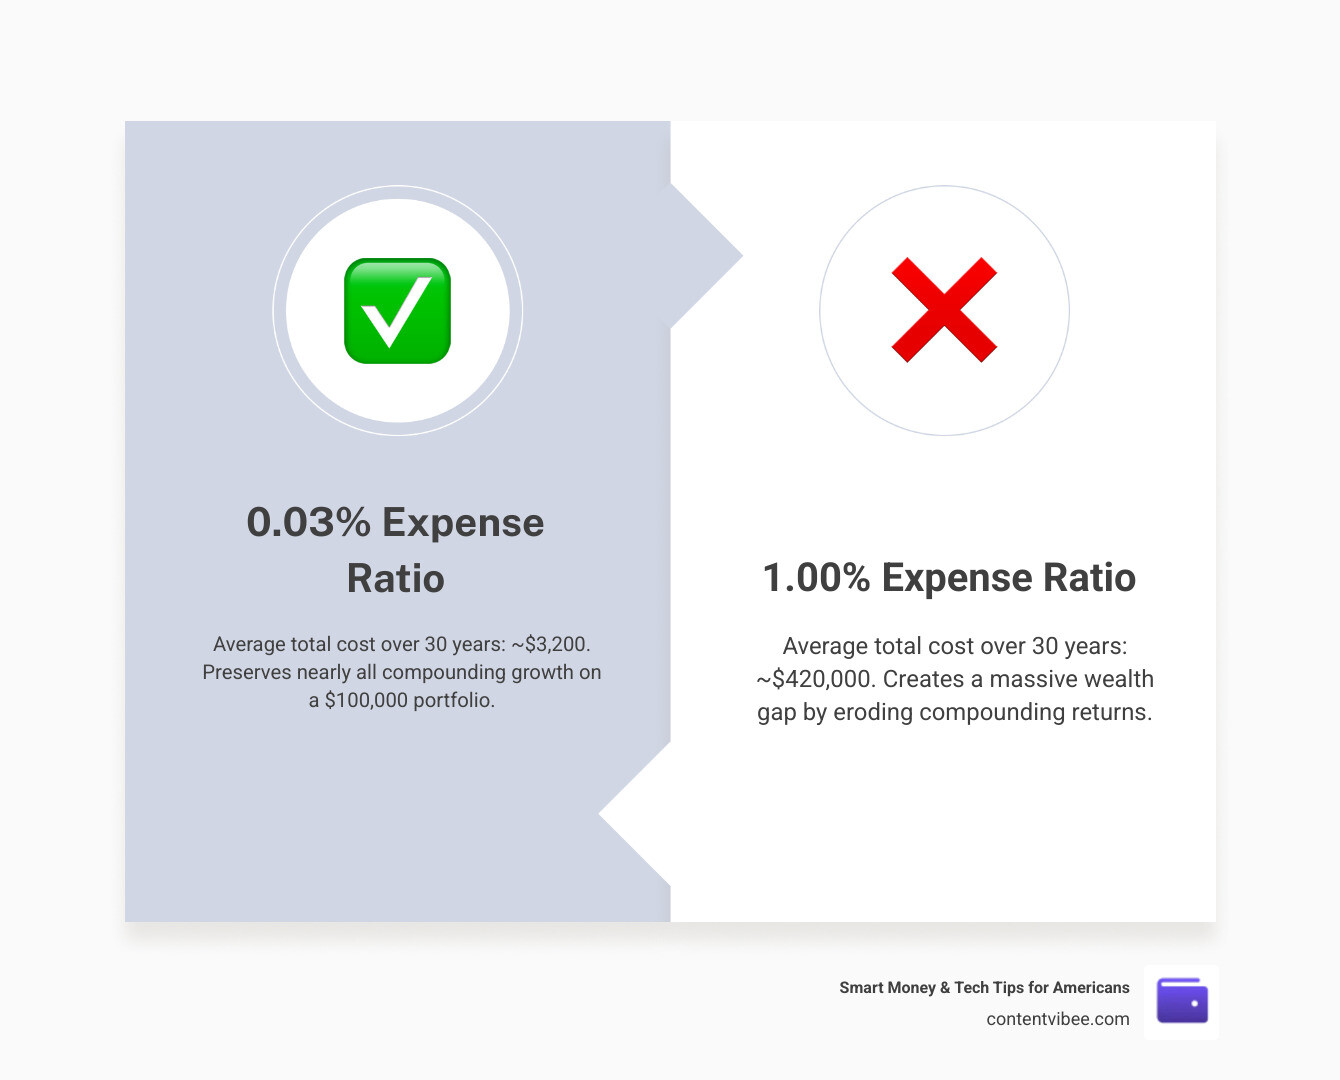
Here’s a number that puts it in perspective: a 1% expense ratio on a $100,000 investment can cost you over $417,000 in lost wealth over 30 years compared to a fund charging just 0.03%. That’s not a typo.
The reason the damage is so large is compounding. Fees don’t just take money out of your pocket today — they take away the future growth that money would have generated. Every dollar lost to fees is a dollar that can no longer compound for your benefit.
According to Morningstar, the average ETF expense ratio is 0.45%. That sounds harmless. But a 0.71% difference in expense ratios between two otherwise similar funds results in a $195,657 difference in retirement savings after 30 years.
That’s the gap a calculator makes visible — in plain dollars, not abstract percentages.
Understanding the Silent Wealth Killer: What is an Expense Ratio?
To protect your portfolio, we first need to understand the enemy. An expense ratio is the annual fee that all mutual funds and exchange-traded funds (ETFs) charge to cover their operating costs. This includes management fees, administrative expenses, and marketing costs (often called 12b-1 fees).
Think of the expense ratio as a “maintenance fee” for your investment. However, unlike a monthly gym membership that you pay with a credit card, these fees are deducted daily from the fund’s Net Asset Value (NAV). This means they are essentially invisible. You won’t see a line item on your monthly statement saying “Fee: $50.” Instead, the fund’s daily performance is simply reduced by a tiny fraction.
Over time, this daily accrual adds up. If a fund has a gross return of 8% but an expense ratio of 1%, your net return is only 7%. While that 1% sounds small, it is actually consuming 12.5% of your annual gains. As we move into May 2026, the industry is seeing massive shifts as investors realize that Why MFS Investment Management Expense Ratio and similar metrics are the most predictable variables in their financial success.
You can find these numbers in a fund’s prospectus or fact sheet. It is vital to distinguish between the “gross” and “net” expense ratio; the net ratio is what you actually pay after any temporary fee waivers are applied.
How to Use an Expense ratio impact calculator for Long-Term Growth
Using an expense ratio impact calculator is a straightforward process that yields life-changing data. To get an accurate picture of your “wealth gap,” you generally need to input five key pieces of information:
- Initial Investment: The lump sum you are starting with today.
- Annual/Monthly Contributions: How much you plan to add to the account over time.
- Expected Annual Return: A realistic growth rate (historically, the S&P 500 averages 8-10% before inflation).
- Time Horizon: How many years until you need the money (e.g., 30 years for a young worker).
- Expense Ratio: The percentage fee of your current fund versus a low-cost alternative.
By entering these details into a tool like the Expense Ratio Calculator – Calculate Fund Costs, you can visualize the “Lost Compounding” effect. The calculator subtracts the fee from your expected return and projects the growth of both scenarios.
We often find that investors are shocked to see that the “cost” of the fee isn’t just the dollar amount paid to the manager; it’s the hundreds of thousands of dollars in growth those fee-dollars would have earned if they had stayed in the account. This is why understanding Why Investment Manager Software Fees matter is so crucial—efficiency in the back end of a fund translates directly to more money in your pocket.
Comparing Fund Types with an Expense ratio impact calculator
When you run the numbers, you will quickly notice a pattern: not all funds are created equal.
- Index ETFs: These are typically the “gold standard” for low costs. Because they simply track a benchmark (like the S&P 500), they require very little human intervention. In 2026, many core index ETFs charge between 0.03% and 0.10%.
- Active Management: These funds employ “star” managers to pick stocks in an attempt to beat the market. For this service, they charge much higher fees—often 0.60% to 1.50%.
- Mutual Funds: While many low-cost index mutual funds exist, older “legacy” mutual funds can still carry high loads and administrative costs.
The asset-weighted average for index funds is roughly 0.07%, while active funds can be 9x more expensive. Using an ETF Expense Ratio Calculator – True Cost of Fees allows you to see if that active manager is actually providing enough “alpha” (outperformance) to justify their price tag. Spoiler alert: research shows that over 80-90% of active managers fail to beat their benchmark over a 15-year period.
Visualizing the Weighted Portfolio Cost
Most of us don’t just own one fund; we own a collection. To get a true sense of your costs, you should calculate your weighted expense ratio.
If 80% of your money is in a low-cost fund (0.03%) and 20% is in an expensive thematic fund (0.75%), your “average” fee isn’t just the middle ground. You must weight them by the dollar amount in each. Furthermore, if you hold individual stocks, those have an expense ratio of 0%. Including them in your calculation gives you a comprehensive view of your total portfolio drag. This is a key reason Why Robo Advisor Fees Comparison Matters; some automated services add an extra layer of advisory fees on top of the underlying fund costs.
The Devastating Math: 0.03% vs. 0.75% Over 30 Years
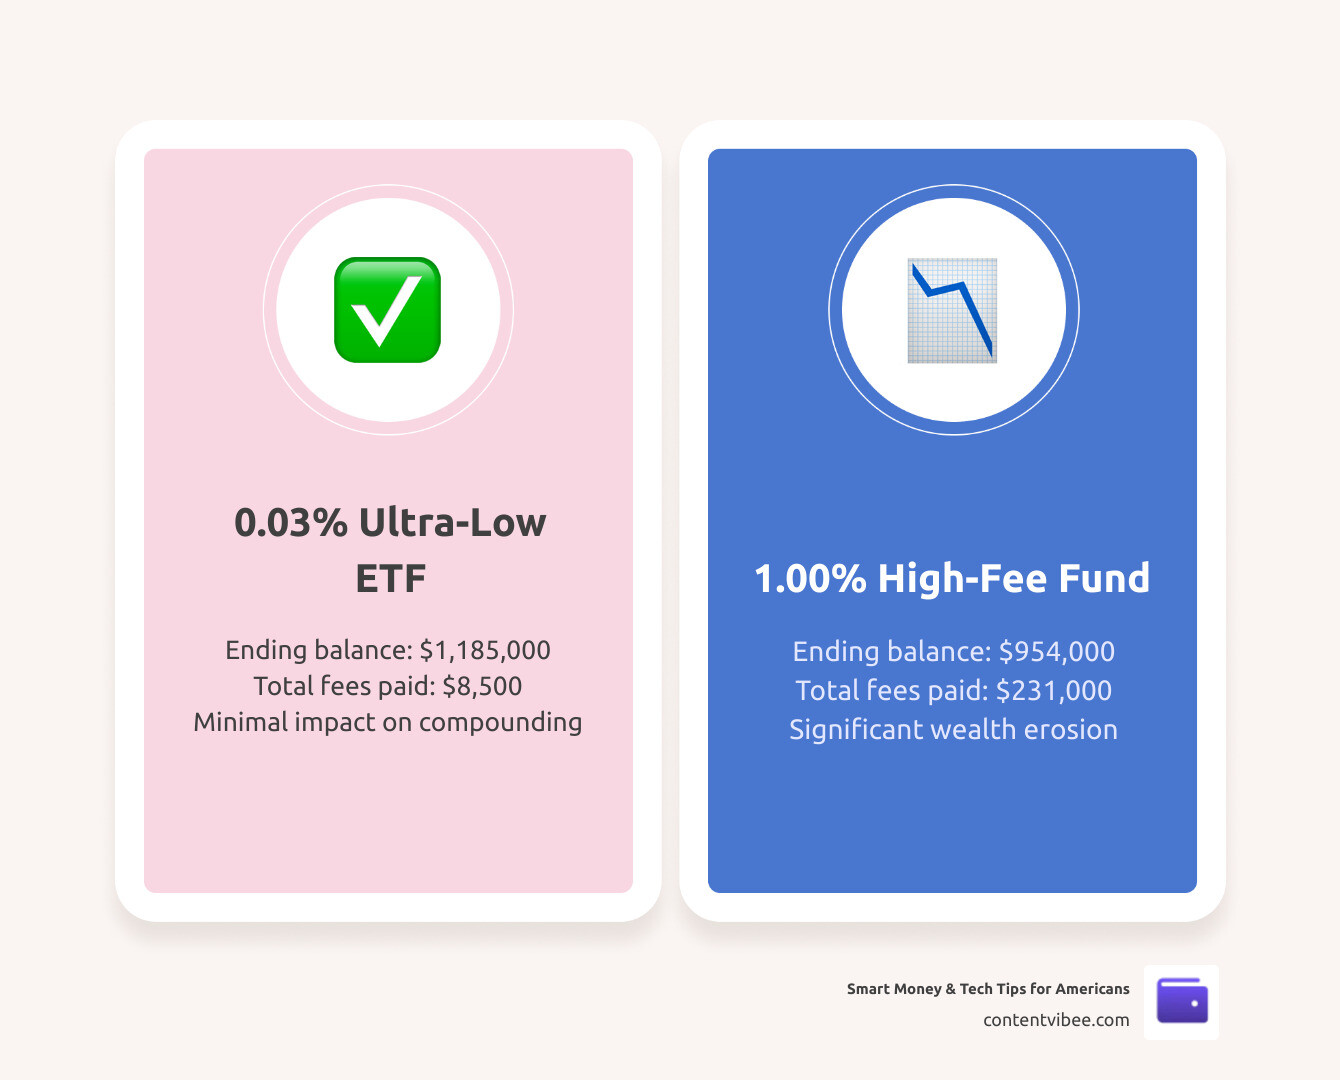
Let’s look at the hard data. Imagine two investors, John and Jane. Both start with $100,000 and contribute $500 monthly for 30 years, earning a 7% gross annual return.
| Expense Ratio | Ending Balance | Total Fees Paid + Lost Growth |
|---|---|---|
| 0.03% (Ultra-Low Index) | $1,185,000 | $8,500 |
| 0.45% (Avg. ETF) | $1,082,000 | $103,000 |
| 1.00% (High-Fee Active) | $954,000 | $231,000 |
Note: Figures are rounded for clarity.
As you can see, the difference between a “standard” 1% fee and an ultra-low 0.03% fee is a staggering $231,000. That is money that could have paid for a house, a decade of retirement travel, or a grandchild’s education.
The opportunity cost is the real killer. When you pay a fee, that money is gone forever. It can’t earn interest next year, and the interest on that interest is lost as well. This “wealth gap” grows exponentially. In our example, a mere 0.71% difference results in nearly $200,000 in lost retirement savings.
Beyond the Ratio: Other Fees That Erode Your Returns
While the expense ratio is the most prominent fee, it isn’t the only one. Smart Money & Tech Tips for Americans wants you to be aware of the “hidden” costs that an expense ratio impact calculator might not always catch:
- Sales Loads: Some mutual funds charge a “front-end load” (often 5.75%) just to buy the fund. This means if you invest $10,000, only $9,425 actually goes to work for you.
- Bid-Ask Spreads: For ETFs, the difference between the price to buy and the price to sell can act as a hidden transaction cost, especially in low-volume funds.
- Tax Drag: Funds with high “portfolio turnover” (constant buying and selling) generate more capital gains distributions, which can increase your tax bill in a taxable brokerage account.
- 12b-1 Fees: These are marketing fees “wrapped” into the expense ratio. Many modern investors avoid these entirely by sticking to no-load funds.
Understanding What Are Wealth Management Fees is essential because if you pay a 1% fee to an advisor plus a 0.75% expense ratio to a fund, you are losing 1.75% of your wealth every year. In a 7% return environment, you are handing over 25% of your annual gains to the financial industry.
Optimizing Your Portfolio Using an Expense ratio impact calculator
How do we fight back? We recommend a core-satellite strategy.
- The Core (80-90%): Place the bulk of your money in ultra-low-cost index ETFs like VOO (S&P 500) or VTI (Total Stock Market), which carry ratios around 0.03%.
- The Satellite (10-20%): If you want to “bet” on a specific sector like tech (QQQ) or innovation (ARKK), do so with a smaller portion of your portfolio. Just be aware that ARKK’s 0.75% ratio is 25 times more expensive than VOO.
Perform regular 401k audits. Many employer-sponsored plans have high-fee funds as the default. If your plan offers a low-cost S&P 500 index fund, that is almost always a better long-term choice than a high-fee “Target Date” fund. Always capture your employer match first—it is a 100% return that easily beats any fee drag—but then look for lower-cost options in an IRA.
Frequently Asked Questions about Investment Fees
What is considered a good or low expense ratio in 2026?
In the current market, “low” has been redefined. For a broad-market index fund (S&P 500 or Total Stock Market), anything above 0.10% is starting to look expensive. The “ultra-low” tier sits between 0.01% and 0.04%. For international funds or bond funds, a ratio under 0.15% is considered very good. If you are being charged more than 0.50% for a standard equity fund, you should have a very strong, data-backed reason for staying.
How do expense ratios interact with annual contributions?
Fees and contributions are a tug-of-war. Regular contributions (monthly additions) help grow your “base,” but the expense ratio is calculated as a percentage of that total base. As your account grows, the dollar amount you pay in fees increases, even if the percentage stays the same. A 1% fee on $10,000 is only $100. But a 1% fee on a $1,000,000 retirement nest egg is $10,000 per year. That’s a significant “spoiler” to your retirement lifestyle.
Can a fund’s expense ratio change after I invest?
Yes. Fund companies can raise or lower fees, though competitive pressure has led to a “fee war” that generally pushes costs down. You must watch for fee waivers. A fund might advertise a “Net Expense Ratio” of 0.05%, but the prospectus might show a “Gross Expense Ratio” of 0.15% with a waiver expiring in twelve months. Always check the expiration date of these waivers.
Conclusion
At Smart Money & Tech Tips for Americans, we believe that financial literacy is the ultimate tech hack for your future. Controlling your investment costs is one of the few variables you can actually manage in an unpredictable market. You can’t control what the Fed does, and you can’t control geopolitical events—but you can control whether you pay 0.03% or 1.00% for your portfolio.
By using an expense ratio impact calculator, you turn abstract numbers into a concrete plan. Don’t let your hard-earned wealth be siphoned away by “invisible” fees. Audit your holdings today, look for low-cost alternatives, and keep those compounding dollars where they belong: in your account.
Secure your financial future with our investment guides