


MFS Investment Management Expense Ratio and Returns Analysis is one of the most important checks you can do before putting money into any MFS mutual fund.
Here is a quick snapshot of the key numbers (as of March 31, 2026):
| Metric | MFEGX (At NAV) | Russell 1000 Growth Index |
|---|---|---|
| 1-Year Return | 10.30% | 18.81% |
| 3-Year Annualized | 17.40% | 21.18% |
| 5-Year Annualized | 8.62% | 12.76% |
| 10-Year Annualized | 14.27% | 16.83% |
| Morningstar Rating | 3 stars (out of 1,004 funds) | N/A |
| Current NAV (April 7, 2026) | $159.32 | N/A |
A few things stand out right away:
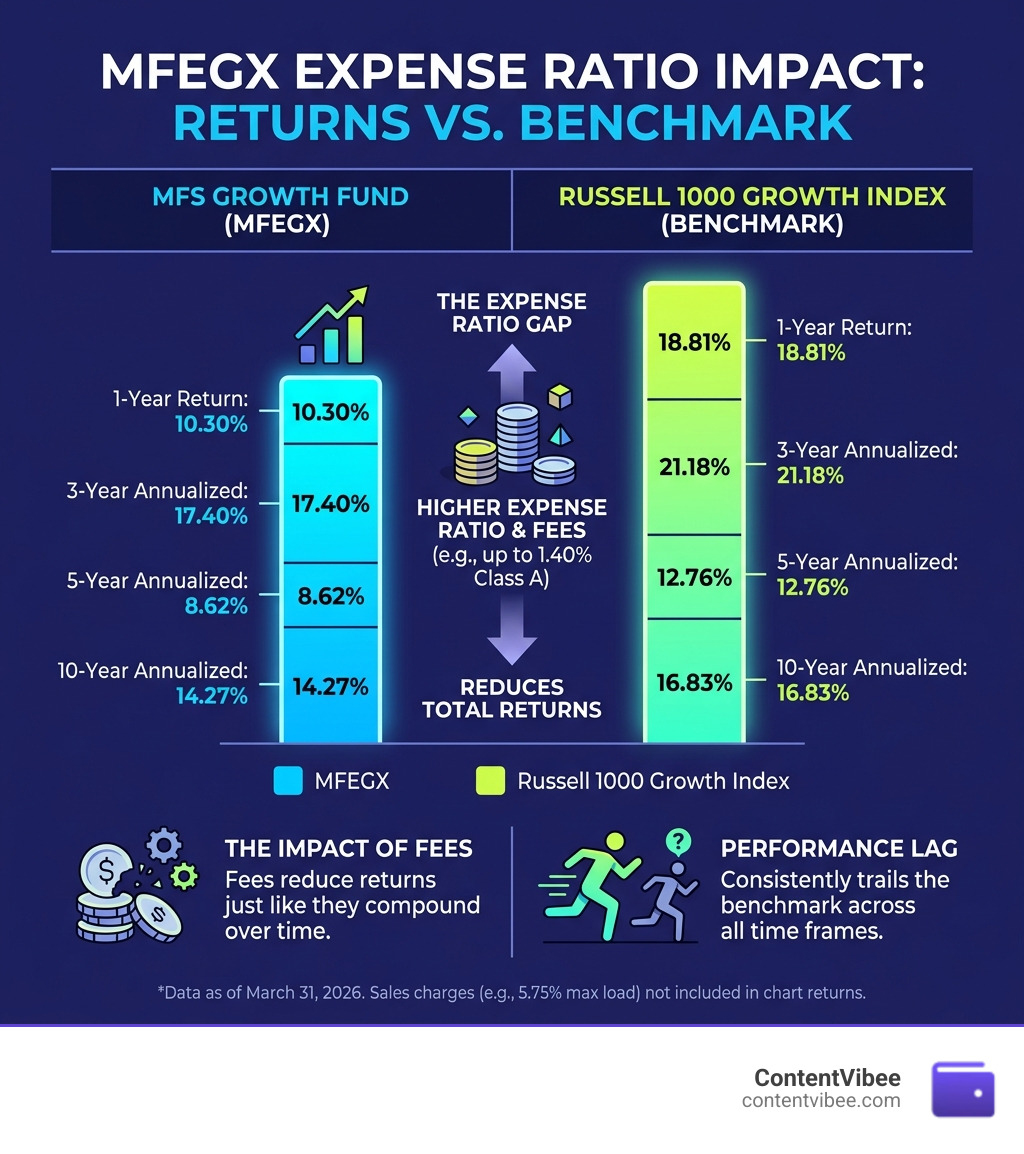
- MFEGX has consistently lagged its benchmark across every major time period.
- Sales charges can reduce your returns further — the maximum load of 5.75% drops the 1-year return from 10.3% down to just 3.95%.
- Expense ratios vary significantly across MFS share classes, from as low as 0.40% (Class R6) to over 1.40% in some cases.
Why does this matter? Because fees compound just like returns do — only in the wrong direction. Even a 0.5% difference in annual costs can shave thousands of dollars off a portfolio over a decade.
This article breaks down exactly what you’re paying, what you’re getting, and how MFEGX stacks up against its peers and benchmark — so you can decide whether MFS funds are worth the cost.
Analyzing MFEGX Fees and Sales Charges

When we look at the MFS Growth Fund (MFEGX), we have to distinguish between the “sticker price” and what you actually end up with in your pocket. In the Large Growth category, MFEGX is a prominent player, but its fee structure is multi-layered.
The fund operates with both a gross expense ratio and a net expense ratio. The gross ratio represents the total operating expenses, while the net ratio reflects contractual fee waivers and reimbursements that MFS has put in place. For many MFS funds, these waivers are scheduled to stay in effect until at least 2027. However, if those waivers were ever removed, your net returns would take a direct hit.
MFEGX sales charge impact: how to recover lost gains and protect your principal USA 2026
One of the biggest hurdles for MFEGX investors is the front-end sales charge, often referred to as a “load.” For Class A shares, this maximum sales charge can be as high as 5.75%.
Think of it this way: if you invest $10,000, $575 is taken off the top before a single cent is actually invested in the market. This explains why the 1-year return for MFEGX at NAV (Net Asset Value) was 10.3%, but once the maximum sales charges were applied, that return plummeted to 3.95%. To protect your principal, we recommend looking into “breakpoints”—discounts on sales charges for larger investments, often starting at $50,000 or $100,000.
Excessive mutual fund fees: how to dispute charges and recover investment losses USA 2026
If you feel you’ve been placed in a high-fee share class without proper disclosure, it is important to understand your rights. High turnover rates (MFEGX has historically maintained a moderate turnover) can also lead to “hidden” costs like transaction fees and higher tax distributions.
When conducting an MFS Investment Management Expense Ratio and Returns Analysis, we must differentiate between the costs of managing the assets versus the costs of the investment strategy itself. For a deeper dive into these differences, check out our guide on Why Asset Management vs Investment Management.
MFS Investment Management Expense Ratio and Returns Analysis: MFEGX vs. Russell 1000 Growth
To truly judge a fund, we have to see how it performs against its “yardstick.” For MFEGX, that yardstick is the Russell 1000® Growth Index.
| Period (Ending March 31, 2026) | MFEGX (NAV) | Russell 1000 Growth Index |
|---|---|---|
| 1-Year | 10.30% | 18.81% |
| 3-Year (Annualized) | 17.40% | 21.18% |
| 5-Year (Annualized) | 8.62% | 12.76% |
| 10-Year (Annualized) | 14.27% | 16.83% |
| Life of Fund | 10.08% | N/A |
MFEGX underperformance recovery: how to dispute high fees and protect your portfolio USA 2026
The data shows a clear trend of benchmark lag. Over the last year, MFEGX trailed the index by a staggering 8.51%. While active management aims to beat the market, the high fees associated with MFS funds often make it difficult for the managers to provide enough “alpha” (excess return) to overcome the expense ratio.
Investors may want to consider whether they are getting enough value for these fees or if they should pivot toward lower-cost options. Understanding the difference between these traditional mutual funds and other vehicles is key; you can learn more in our article Understanding Traditional vs Alternative Investments.
MFEGX investment loss recovery: strategies to mitigate volatility and protect portfolio value USA 2025
Looking back at the annual rates of return, MFEGX has been a bit of a roller coaster:
- 2025: +12.03%
- 2024: +31.34%
- 2023: +35.79%
- 2022: -31.32%
- 2021: +23.34%
The massive 31% drop in 2022 highlights the volatility inherent in Large Growth funds. If you are using MFS funds as part of a state-sponsored or employer plan, know how these fluctuations impact your retirement timeline. See What You Need to Know About FRS Investment Plan for more context on managing plan-specific risks.
Morningstar Ratings and Risk-Adjusted Performance
Morningstar currently gives MFEGX a 3-star overall rating out of 1,004 Large Growth funds. This rating is based on risk-adjusted performance, meaning it doesn’t just look at how much money the fund made, but how much “heartburn” (risk) it took to get there.
The 3-star rating suggests that MFEGX is essentially a “middle-of-the-pack” performer. While it isn’t failing, it isn’t leading the category either. For investors, this often raises the question of whether the management fee is justified. When we compare the high-touch service of wealth management to the raw numbers of investment management, the choice becomes even clearer. We discuss this in our piece on Why Wealth Management vs Investment Banking.
High-fee mutual fund class C shares: how to switch and protect long-term investment growth USA
MFS offers various share classes, and not all are created equal. For example:
- MNWAX (Managed Wealth Fund Class A): Often carries a front-end load.
- MTRCX (Total Return Fund Class C): Usually has no front-end load but carries a much higher annual expense ratio (often around 1.47% to 1.48%).
Class C shares are often the most expensive for long-term investors because that high annual fee never goes away. If you’ve been in Class C shares for more than 8 years, they may automatically convert to Class A shares, which have lower ongoing expenses. We recommend checking your statements to see if you can switch to a lower-cost share class like Class I or R6 if you are eligible.
NAV Trends and Long-Term Growth Trajectory
As of April 7, 2026, the Net Asset Value (NAV) of MFEGX stands at $159.32. This represents the price per share of the fund. Recent trends show a daily change of +0.26 (+0.16%), indicating the fund is following the broader market’s attempt to find stability in the second quarter of 2026.
The long-term growth trajectory of MFEGX has been positive, with a 14.27% 10-year annualized return. However, when we account for inflation and the 5.75% initial sales charge, the “real” growth for a retail investor is notably lower than the headline numbers suggest.
Investment risk recovery: how to fix portfolio losses and protect your SSN from financial fraud USA
Beyond market risk, investors in 2026 must be wary of digital risks. Unauthorized access to brokerage accounts can lead to more than just investment losses; it can lead to identity theft. If you notice strange transactions or changes to your account details, it is crucial to act immediately to protect your Social Security Number and financial identity.
MFS provides various disclosures regarding fund safety, such as those found in the MFS Government Markets Income Trust filings, which highlight how even “safe” government-backed funds carry interest rate and credit risks.
Frequently Asked Questions about MFS Investment Management
What is the current expense ratio for MFEGX in 2026?
The expense ratio for MFEGX varies by share class. Class A shares typically hover around 0.90% to 1.00% before waivers. However, MFS often employs contractual waivers that can bring the net expense ratio down. Always check the most recent prospectus (dated February 2026 or later) for the exact figure.
How does MFEGX performance compare to the Russell 1000 Growth Index?
Historically, MFEGX has underperformed the Russell 1000 Growth Index. For the 1-year period ending March 2026, MFEGX returned 10.30% compared to the index’s 18.81%. Over 10 years, the gap is narrower but still exists (14.27% for the fund vs. 16.83% for the index).
Are there sales charge waivers available for MFS funds?
Yes. Investors can often qualify for sales charge waivers if they invest large amounts (breakpoints), are part of an employer-sponsored retirement plan, or work with certain financial intermediaries. Additionally, Class C shares generally convert to Class A shares after a holding period of 8 years, reducing the annual fee burden.
Conclusion
Our MFS Investment Management Expense Ratio and Returns Analysis reveals a complex picture. While MFS offers a storied history and a disciplined “bottom-up” investment approach, the costs of entry—specifically the 5.75% front-end load on many Class A shares—can be a major drag on performance.
When you combine those initial costs with a 10-year track record that lags the Russell 1000 Growth benchmark, it becomes clear that investors must be selective about which MFS funds and share classes they utilize. Focus on low-cost classes like R6 or I whenever possible, and always keep an eye on those Morningstar risk-adjusted ratings.
At ContentVibee, we believe that understanding what you’re paying is the first step to financial recovery and growth. For more insights on how to keep more of your hard-earned money, visit our category page for money and credit services.