


The Silent Wealth Killer: Why an Expense Ratio Impact Guide Could Save You Thousands
This expense ratio impact guide gives you a fast answer up front:
| Expense Ratio | $100,000 After 30 Years (7% gross return) | Wealth Lost vs. 0.10% |
|---|---|---|
| 0.10% | ~$740,000 | – |
| 0.50% | ~$660,000 | ~$80,000 |
| 1.00% | ~$574,000 | ~$165,800 |
| 1.50% | ~$510,000 | ~$230,000 |
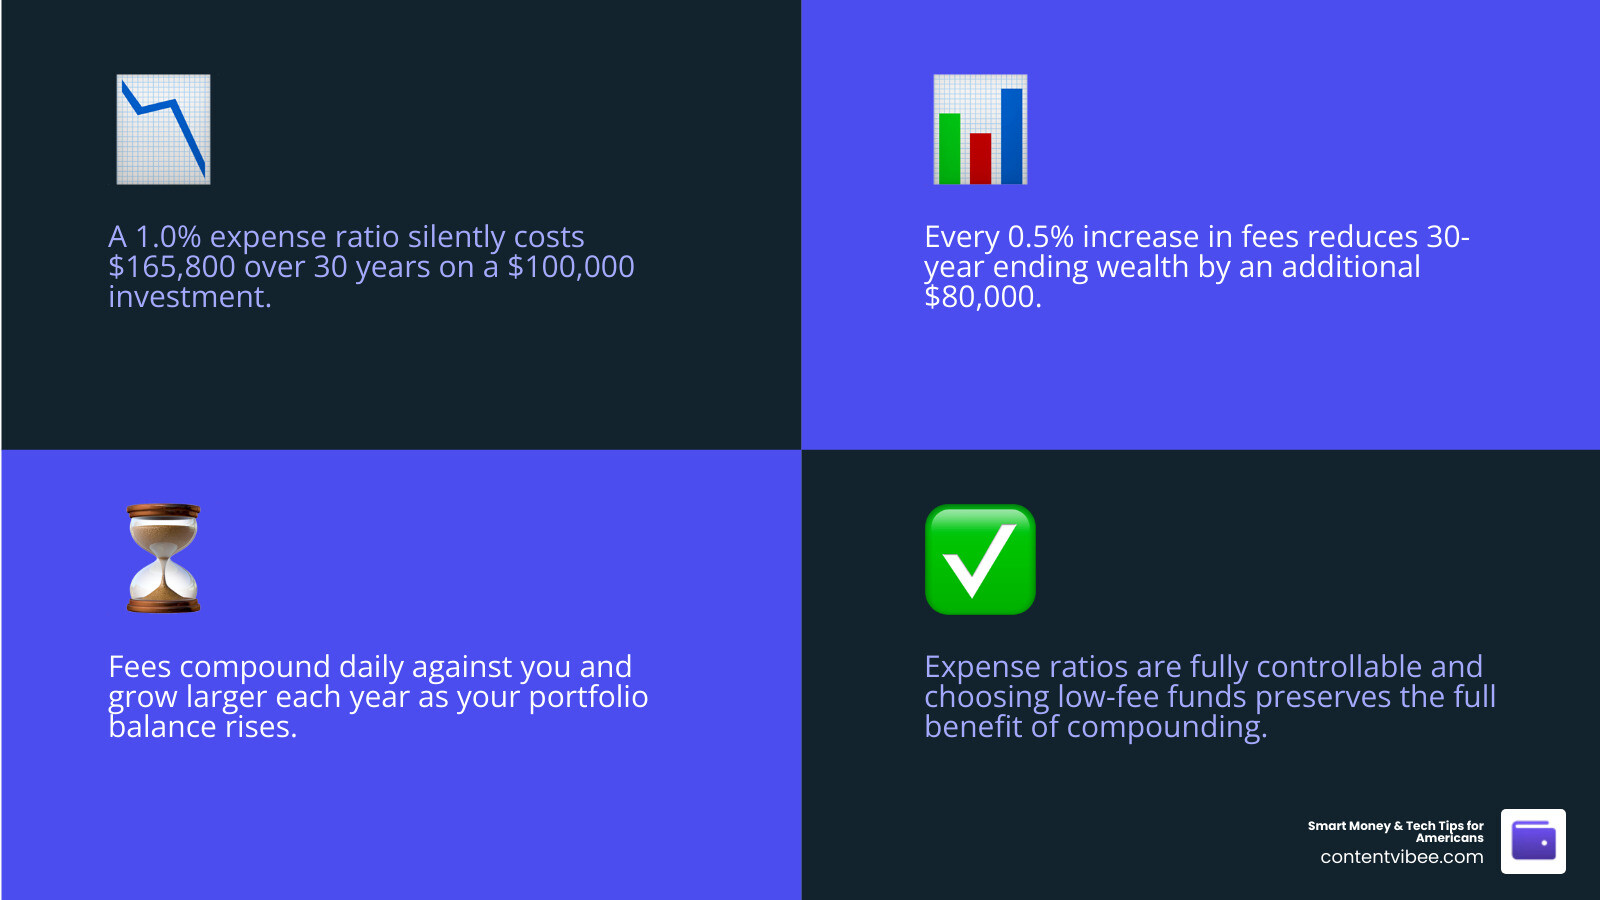
The bottom line: A difference of just 1% in annual fees can cost you over $165,000 in real wealth over 30 years — on a single $100,000 investment.
Here’s the problem most investors never realize: you will never get a bill for your fund’s expense ratio.
No invoice. No line item on your bank statement. The fee is quietly deducted every single day from your fund’s value before you ever see a return figure. Because the cost is invisible, most people ignore it entirely. Financial experts call this fee salience — or more accurately, the lack of it.
But invisible doesn’t mean harmless.
A 1% annual expense ratio on a growing portfolio costs you $1,000 in year one. By year 25, that same 1% is quietly draining over $5,400 per year — because the fee is always calculated on a larger and larger balance. That’s negative compounding: fees that accelerate as your wealth grows, working against you in the exact same way that investment returns work for you.
And if you’re managing finances during a major life transition — like a divorce — overlooking high fund fees inside a 401(k) or brokerage account can quietly erase tens of thousands of dollars you can’t afford to lose.
The good news? Unlike market performance, expense ratios are entirely within your control.
Understanding the Mechanics: What is an Expense Ratio?
At its core, an expense ratio is the price of admission for owning a mutual fund or Exchange-Traded Fund (ETF). It represents the percentage of your total investment that goes toward the costs of running the fund each year.
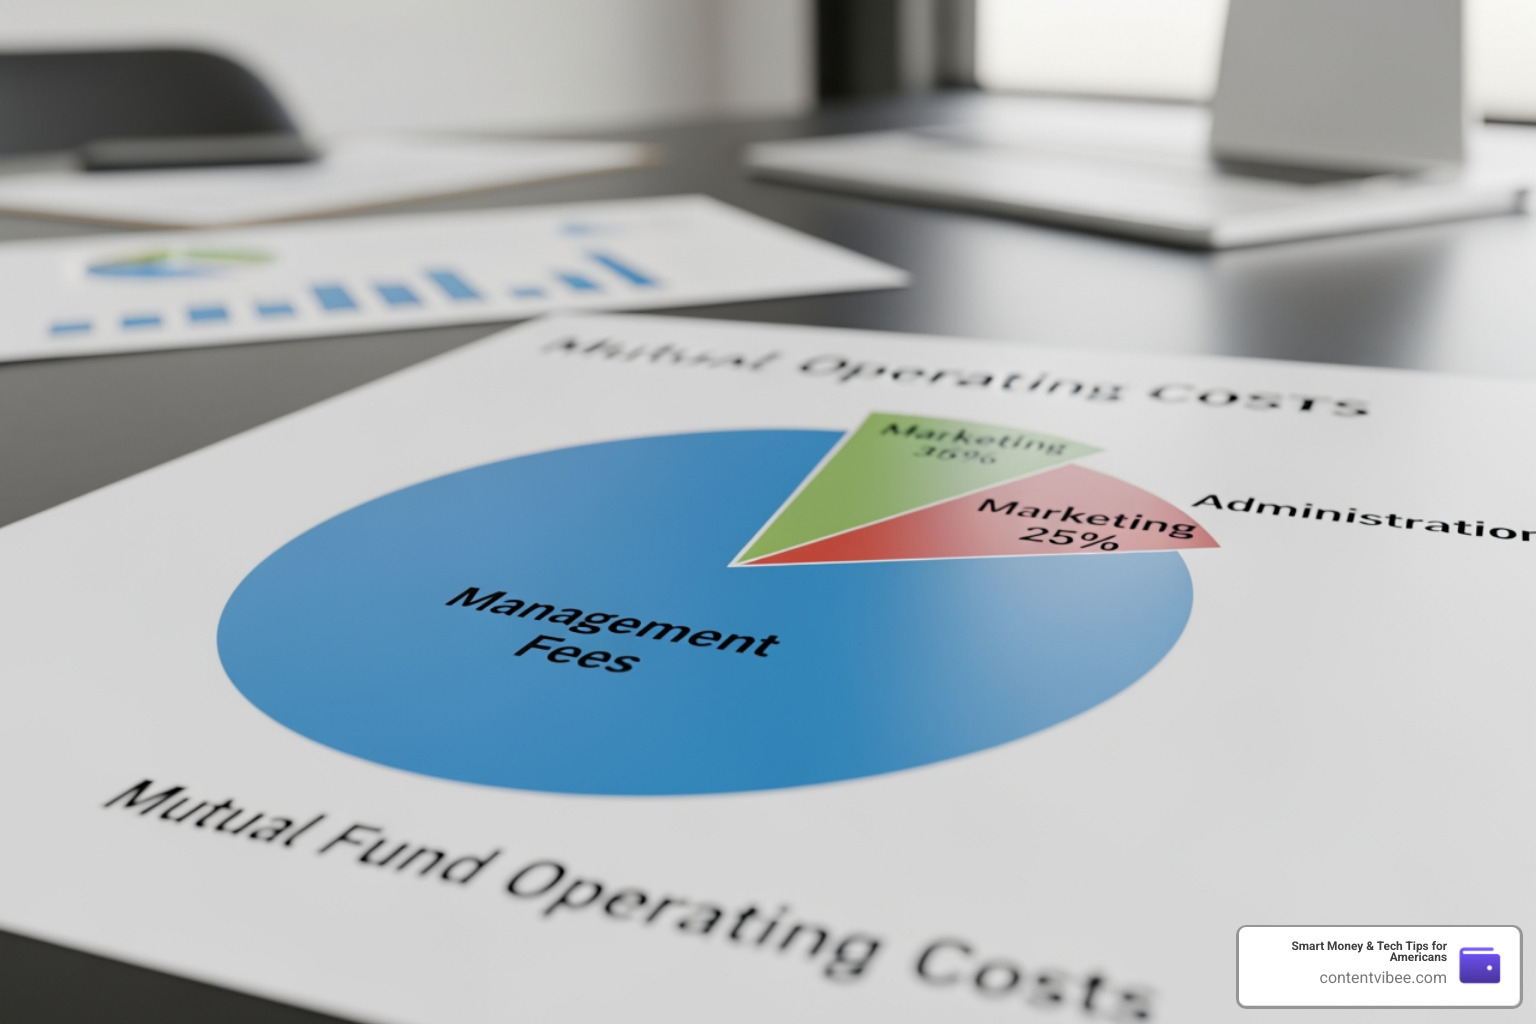
Think of it as the “overhead” of your investment. These costs aren’t just for the fund manager’s salary; they cover a wide range of operational necessities. Expense Ratio: Fund Fees Explained | Ryan OConnell, CFA breaks down these costs into several key buckets:
- Management Fees: The compensation paid to the professional portfolio managers who decide which stocks or bonds to buy.
- 12b-1 Fees: These are essentially marketing and distribution fees. If you see a fund advertised on TV, you might be paying for that ad through this fee.
- Administrative Expenses: The “boring” but necessary costs like legal fees, accounting, and record-keeping.
- Custodial Costs: Fees paid to the bank or institution that physically holds the fund’s assets for safekeeping.
How Expense Ratios are Calculated and Paid
The calculation is straightforward: Expense Ratio = Total Fund Operating Expenses / Average Net Assets. For example, if a fund has $10 million in assets and costs $100,000 a year to run, the expense ratio is 1%.
But here is the “magic” trick the industry plays: you don’t pay this via a check. It is a Net Asset Value (NAV) deduction. The fee is accrued daily. If a fund has an annual fee of 0.365%, the fund company effectively takes 0.001% of the fund’s value every single day.
Because this happens before the daily “closing price” is reported, the performance you see on your dashboard is already “net of fees.” This makes it incredibly easy to forget you’re paying them at all. It’s the ultimate “invisible billing” system.
Gross vs. Net Expense Ratio: The Impact Guide to Fee Waivers
When you look at a fund’s prospectus, you might see two different numbers: Gross and Net. Understanding the difference is vital for your long-term planning.
The Gross Expense Ratio is the total percentage the fund would charge if no discounts were applied. The Net Expense Ratio is what you actually pay right now. Why the difference? Fund companies often use contractual waivers or reimbursement caps to keep fees low and attract new investors.
However, these waivers often have expiration dates. If you choose a fund because it has a 0.05% net ratio, but the gross ratio is 0.85%, you need to know when that “sale” ends. If the waiver expires, your costs could skyrocket overnight. This is why checking Why MFS Investment Management Expense Ratio details can be so helpful; it shows how institutional players manage these shifts.
The Math of Erosion: An Expense Ratio Impact Guide
To truly understand why we are so passionate about low fees, we have to look at the “Arithmetic of Loss.” When you pay a fee, you aren’t just losing that dollar today. You are losing every cent that dollar would have earned over the next few decades.
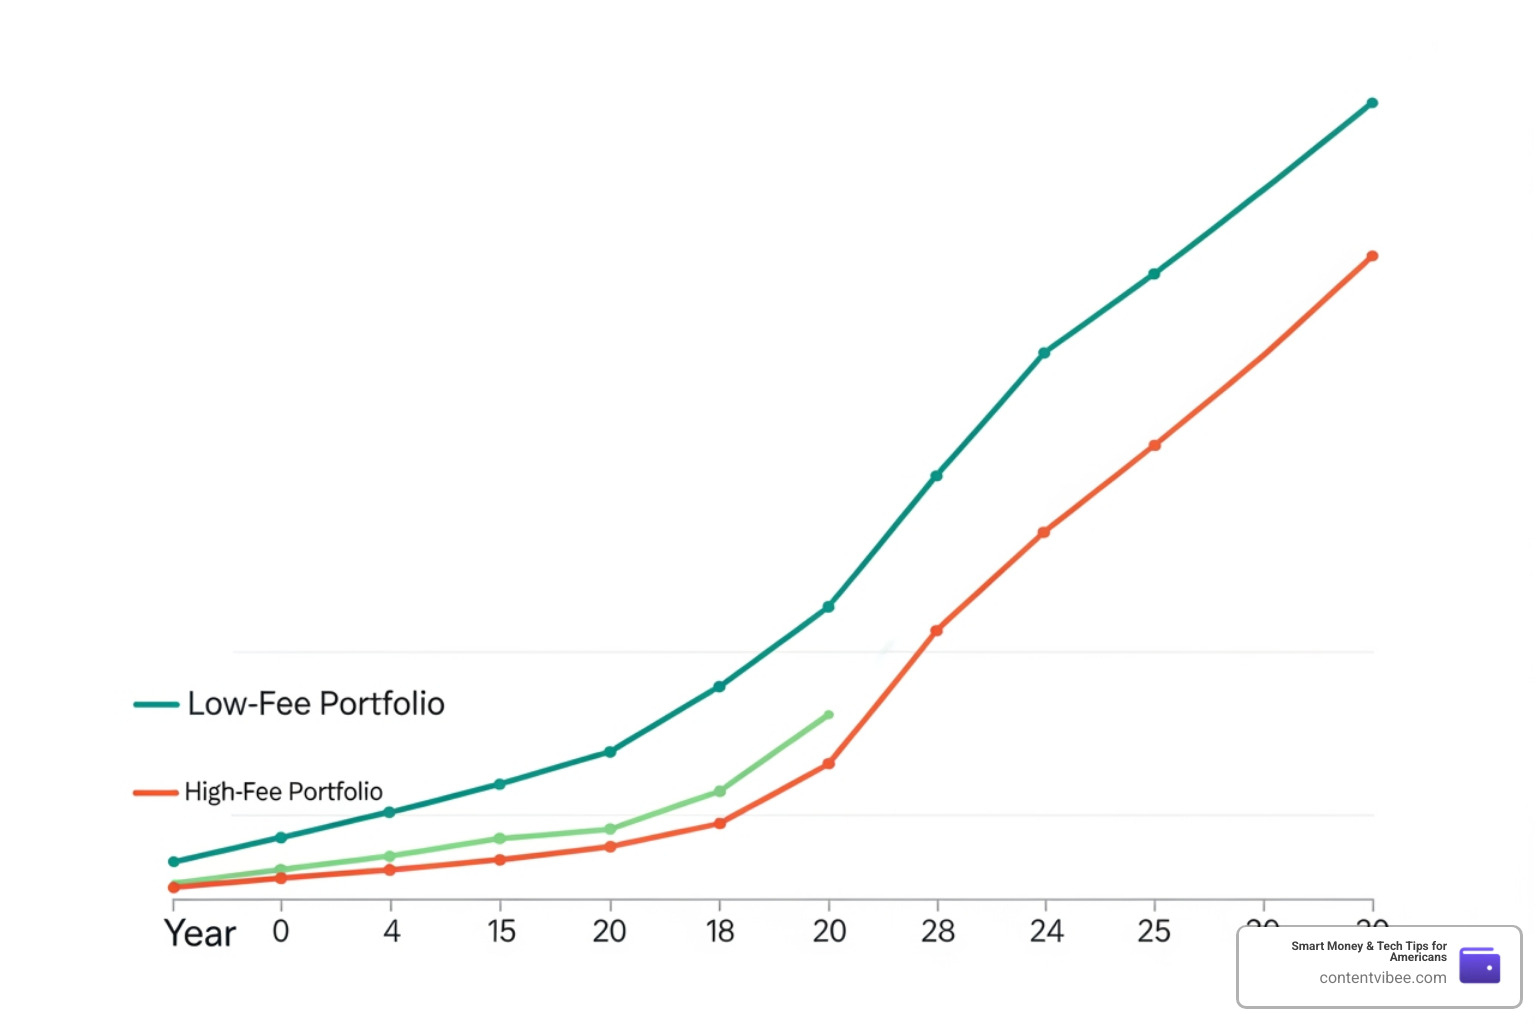
Let’s look at how a 0.90% difference (1.0% vs. 0.1%) impacts a $100,000 investment over a 30-year horizon, assuming a 7% gross annual return:
| Year | Portfolio at 0.10% Fee | Portfolio at 1.00% Fee | The Wealth Gap |
|---|---|---|---|
| 1 | $106,900 | $106,000 | $900 |
| 10 | $194,900 | $179,000 | $15,900 |
| 20 | $380,000 | $320,700 | $59,300 |
| 30 | ~$740,169 | ~$574,349 | $165,820 |
As this expense ratio impact guide demonstrates, the gap starts small but becomes a chasm. By year 30, you have surrendered over 22% of your potential ending wealth to the fund manager. This data, supported by research from Expense Ratio: The Real Cost Draining Your Returns (2026), proves that the fee is often the single most reliable predictor of your future return.
The 0.10% Rule for Core Portfolio Holdings
In May 2026, the “Fee Wars” between giants like Vanguard, Schwab, and Fidelity have reached a fever pitch. This is incredible news for us as investors. We now live in an era of “wholesale pricing” for the average American.
At Smart Money & Tech Tips for Americans, we advocate for the 0.10% Rule: For your core portfolio holdings (Total Stock Market, S&P 500, or Total Bond Market), you should never pay more than 0.10%.
In fact, many leading index funds now charge as little as 0.03% or even 0.015%. When you can buy the entire U.S. economy for three basis points, paying 0.75% for a “closet index” fund is essentially a gift to Wall Street. Even specialized platforms are feeling the pressure, as seen in Understanding Wealthfront Investment Fees, where automated management is becoming increasingly cost-competitive.
Why a 0.5% Difference Leads to a Massive Wealth Gap
It’s easy to think, “It’s just half a percent, who cares?” But in compounding, 0.5% is massive. Over a 20-year horizon, a 0.5% difference in fees on a $100,000 investment can result in a $20,000 to $30,000 difference in your final balance.
This happens because of exponential drag. In the early years, your contributions drive your growth. In the later years, your balance drives your growth. Because the fee is a percentage of that balance, the “dollar cost” of the fee explodes just as you are nearing retirement. A 1% fee on a $500,000 portfolio is $5,000 a year. If you are trying to save $20,000 a year, that fee is effectively “stealing” 25% of your savings effort!
Benchmarking Your Portfolio: What is a ‘Good’ Fee in 2026?
What was considered “cheap” ten years ago is considered “expensive” today. To keep your portfolio on track, you need to know the current industry benchmarks.
According to 2024-2025 industry data, here is what we consider a “good” expense ratio for various categories:
- Broad U.S. Equity ETFs: 0.01% – 0.07%
- Total Bond Market Funds: 0.03% – 0.10%
- International/Developed Markets: 0.05% – 0.15%
- Actively Managed Funds: 0.40% – 0.75% (Anything over 1.0% is a “red flag”)
- Target Date Funds: 0.08% – 0.15%
If you are paying more than these averages, you need to ask yourself if the fund is providing enough “alpha” (outperformance) to justify the extra cost. As noted in How to Evaluate ETF Expense Ratios — Step-by-Step Guide for ETF Investors | My ETF Journey, comparing within the same category is the only way to get a fair assessment.
Expense Ratio Impact Guide: ETFs vs. Mutual Funds
Generally speaking, ETFs are the kings of low costs. In 2024, the average equity mutual fund expense ratio was 0.40%, while the average equity ETF was just 0.14%.
ETFs are typically more tax-efficient because of their “in-kind” redemption process, which helps avoid capital gains distributions. Mutual funds, particularly “Retail” share classes, often carry higher administrative burdens. However, if you have access to “Institutional” or “Admiral” share classes in your 401(k), mutual funds can sometimes match or even beat ETF pricing.
Does Higher Cost Equal Better Performance?
The short answer is: No.
In fact, the data suggests the opposite. The SPIVA (S&P Indices vs. Active) data consistently shows that over a 15-year period, more than 90% of active managers fail to beat their benchmark index.
When you pay a high expense ratio for active management, you are starting the race 100 meters behind the index. The manager has to not only pick winning stocks but also outperform by more than the fee just to break even with a “boring” index fund. This is why Why Robo Advisor Fees Comparison Matters is such a hot topic; many investors are realizing that automated, low-cost indexing is the more reliable path to wealth.
Beyond the Ratio: Identifying Hidden Costs of Ownership
The expense ratio is the most visible cost, but it’s just the tip of the iceberg.
To find the “Total Cost of Ownership,” we have to look below the surface:
- Bid/Ask Spreads: This is the difference between what you can buy an ETF for and what you can sell it for. For highly liquid funds like those tracking the S&P 500, this is negligible. For niche or small-cap ETFs, this can add an extra 0.10% to 0.50% to your “entry and exit” costs.
- Portfolio Turnover: If a fund manager is constantly buying and selling stocks, the fund incurs trading commissions and “market impact” costs. These are not included in the expense ratio but they still drain the fund’s returns.
- Tracking Error: This is the difference between a fund’s return and the index it’s supposed to follow. If an index returns 10% and your fund (with a 0.05% fee) only returns 9.8%, you have a 0.15% “hidden cost” due to poor tracking.
- Tax Drag: High-turnover mutual funds often spit out capital gains distributions in December, even if you didn’t sell a single share. This creates a tax bill that further erodes your net wealth.
Auditing Your 401(k) and Brokerage Accounts
Many Americans are stuck in “legacy” 401(k) plans filled with high-cost retail share classes. Here is how we recommend you perform a “fee audit”:
- Check for “Institutional” Eligibility: If your company has grown, you might now be eligible for cheaper share classes of the same funds you already own.
- Look for Revenue Sharing: Some 401(k) funds have “12b-1” fees baked in that go back to the plan provider. Look for “Index” options which usually lack these kickbacks.
- Use the “Brokerage Link” Option: Many modern 401(k) plans (like those at Fidelity or Schwab) offer a “Self-Directed” or “Brokerage Link” window. This allows you to move your money out of the expensive internal plan funds and into any low-cost ETF on the open market.
- Read the Summary Plan Description (SPD): This document is legally required and must disclose all administrative fees. Sometimes a fund looks cheap (0.05%), but the plan adds a 0.30% “record-keeping fee” on top of it.
Frequently Asked Questions about Expense Ratios
How do I find the expense ratio of my 401(k) funds?
Log into your provider’s portal and look for a “Research” or “Fund Performance” tab. You are looking for a column labeled “ER,” “Exp Ratio,” or “Total Annual Operating Expenses.” If it’s not there, search for the Ticker Symbol (a 5-letter code like FXAIX) on a site like Morningstar or Google Finance. Every fund is also required to send you an Annual Fee Disclosure statement once a year—don’t throw that in the recycling bin!
When is it worth paying a higher expense ratio?
There are rare times when a higher fee is justified. This usually applies to Specialized Sectors (like Biotechnology or Cybersecurity), Emerging Markets (where local expertise is required to navigate complex foreign exchanges), or Alternative Assets (like Reinsurance or Private Credit). If the strategy cannot be easily replicated by a computer and the manager has a proven, multi-decade track record of outperforming after fees, a 0.50% to 0.75% fee might be acceptable.
Can a fund’s expense ratio change over time?
Yes. As a fund grows and achieves scale efficiencies, the provider will often lower the fee to remain competitive. Conversely, if a fund loses assets or changes management, the fee could go up. This is why we recommend a “portfolio physical” once a year to ensure your “cheap” funds haven’t become “expensive” while you weren’t looking.
Conclusion
At Smart Money & Tech Tips for Americans, we believe that you shouldn’t have to work three months out of the year just to pay your fund manager. Controlling your investment costs is the only “guaranteed” way to increase your returns. By using this expense ratio impact guide to audit your accounts, you can stop the “fee bleeding” and keep more of your hard-earned wealth where it belongs: in your pocket.
Ready to take the next step in your financial journey? Whether you’re optimizing your retirement or navigating complex state-specific financial rules in California, we’re here to help. Take control of your financial future today and ensure your money is working as hard for you as you did for it.


