


Does the Zacks Rank Actually Beat the Market? Here’s the Quick Answer
If you’ve been looking into a zacks rank review, here’s what you need to know upfront:
Quick Verdict:
| Factor | Details |
|---|---|
| What it is | A 1-5 stock rating system based on earnings estimate revisions |
| #1 Strong Buy historical return | ~23.9% average annual return since 1988 |
| S&P 500 comparison | ~11.3% average annual return over the same period |
| #5 Strong Sell return | ~2.6% average annual return |
| Best for | Active, self-directed investors comfortable filtering large lists |
| Not ideal for | Beginners or passive investors |
| Cost to access full system | $249/year (Zacks Premium) |
| User satisfaction | 1.6-1.8/5 on Trustpilot — a real concern |
The numbers look impressive on paper. But the real question is whether those returns hold up for you, as an actual investor — not a backtest.
Zacks Investment Research has been around since 1978. The company built its name on one core idea: earnings estimate revisions are the most powerful force driving stock prices. That insight was genuinely novel when founder Len Zacks developed it while studying at MIT. Decades later, it still forms the backbone of the entire rating system.
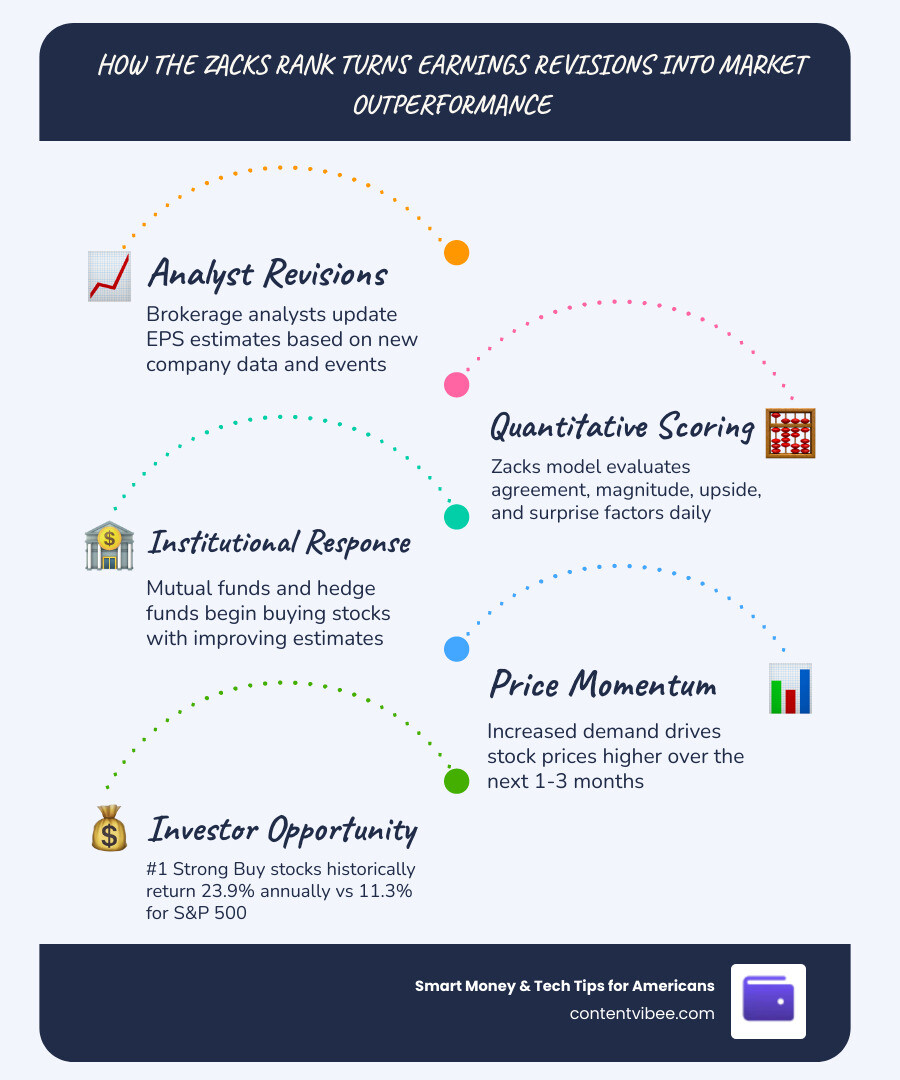
The promise is simple. When Wall Street analysts revise their earnings forecasts upward, big institutions — mutual funds, hedge funds, banks — start buying. That takes time. Individual investors who act fast can get in first.
But does it actually work in practice? The headline stats say yes. Real user reviews say… it’s complicated.
How the Zacks Rank Methodology Works
At its heart, the Zacks Rank is a quantitative model. It doesn’t care about a CEO’s charisma or how “disruptive” a new product sounds. It cares about numbers—specifically, the numbers provided by professional brokerage analysts.
We often think of the stock market as a place where individual news stories drive prices. While that’s true in the short term, Zacks argues that the real momentum comes from institutional behavior. When an analyst at a major firm raises their Earnings Per Share (EPS) estimate for a company, it’s rarely a random guess. It’s based on new data.
Because large institutional buyers take weeks or even months to build their massive positions, the price doesn’t jump all at once. This creates a window—usually a 1-3 month horizon—where the stock has a statistical tailwind. By following these revisions, the Zacks Rank attempts to catch that wave. You can find more detail on this in The Zacks rank explained: How to find strong buy computer and technology stocks.
The system covers roughly 4,400 stocks, but it’s the top 5%—the #1 Strong Buys—that get all the glory. To see the full breakdown of how these are categorized, you can check out the official Zacks Stock Rank page.

The Quantitative Methodology Behind a Zacks Rank Review
When we conduct a zacks rank review, we have to look under the hood at the “Four Pillars” of their mathematical model. These aren’t just guesses; they are specific calculations designed to remove human emotion from the equation:
- Agreement: This looks at whether multiple analysts are moving their estimates in the same direction. If one person raises an estimate, it might be a fluke. If ten people do it, something is happening.
- Magnitude: Size matters. A 1% increase in expected earnings is okay, but a 20% jump is a massive signal.
- Upside: This measures the difference between the most recent analyst estimate and the overall consensus. If the newest estimate is much higher than the old average, the stock is likely underpriced.
- Surprise: Does the company have a habit of beating expectations? Zacks looks at the last few quarters to see if a company consistently delivers “positive earnings surprises.”
This systematic approach is why many wonder Is Zacks Investment Research Worth Paying For? because it offers a level of data processing that a human simply can’t do on their own.
Comparing Quantitative vs. Fundamental Research
Most investors are used to fundamental research. This is where an analyst looks at the “moat” of a business, the quality of the management team, and the overall industry health. It’s subjective. One analyst might love a company’s strategy while another hates it.
Zacks takes a different path. Their primary rank is purely quantitative. It’s a mathematical “firehose” that processes over 500,000 earnings estimates daily from more than 3,000 analysts. There is no room for gut feelings in the #1 to #5 ranking.
However, Zacks does offer a “Zacks Recommendation” for about 1,200 stocks. This is where their staff of 70 analysts can actually override the model based on things like valuation or industry conditions. This hybrid approach is often utilized by institutional platforms like Zacks Investment Research – Fidelity – Log In to give a more rounded view of a stock’s potential.
Historical Performance: Does it Really Outperform the S&P 500?
This is the “million-dollar question.” Zacks claims that their #1 Strong Buy stocks have averaged a 23.9% annual return over the last 36 years. During that same period, the S&P 500 averaged about 11.3%.
If you had invested $10,000 in the S&P 500 in 1988, you’d be doing very well today. If you had theoretically invested it in the Zacks #1 list and rebalanced perfectly, the numbers would be astronomical. But—and this is a big “but”—those returns assume you are buying every single #1 rank stock and rebalancing frequently.
The system has beaten the market in 26 out of the last 30 years. That is a track record few human fund managers can claim. It’s a primary reason why people ask Is the Zacks Investment Research Premium Worth? when they see those double-digit outperformance stats.

Analyzing Accuracy in a Zacks Rank Review
When we talk about “accuracy” in a zacks rank review, we aren’t saying every stock goes up. Zacks claims a success rate of about 70% for their #1 Rank stocks in terms of beating the market over a short time horizon.
However, real-world results can vary. Some users on review platforms have noted that while the “Strong Buy” list is huge (usually around 220 stocks), picking just one or two can be a gamble. The success of the system relies on the law of large numbers. If you buy 25 of them, the winners should outweigh the losers.
Performance isn’t just about the Buys, though. The #5 Strong Sell list has averaged only a 2.6% return. This suggests that the system is actually very good at identifying which stocks to avoid, which is just as important for your portfolio. This dual-sided accuracy is a major point in the debate over Is Zacks Investment Research Worth the Price Tag?.
The Impact of Earnings Surprises
One of the coolest tools in the Zacks arsenal is the Expected Surprise Prediction (ESP) filter. This tool looks for stocks that have a high probability of beating their earnings estimates before the report is even released.
According to their 10-year backtest, when a stock has a Zacks Rank of #1, #2, or #3 and a positive Earnings ESP, it results in a positive earnings surprise 70% of the time. This is a massive edge for traders who like to play “earnings season.” It allows you to anticipate institutional buying before the general public sees the headline on the news.
Pros and Cons of the Zacks Rank Review
No tool is perfect. In our zacks rank review, we’ve found that while the data is world-class, the user experience can be a bit overwhelming for some.
| Feature | Pros | Cons |
|---|---|---|
| Data Quality | Objective, math-driven, and updated daily. | Can lead to “analysis paralysis.” |
| Performance | Proven 30+ year track record of beating the S&P 500. | Past performance doesn’t guarantee future results. |
| Tools | Powerful screeners and ESP filters. | High turnover requires frequent trading. |
| Risk Management | The #5 Sell list helps avoid “landmines.” | Trustpilot ratings highlight billing/service issues. |
The “high turnover” mentioned above is a real factor. The #1 Rank list can change daily, with about 20 stocks being added or deleted every single day. If you aren’t an active trader, keeping up with this can feel like a full-time job. You can read more about these trade-offs in this Zacks Premium Review 2026: Pros & Cons.
Real User Experiences and Red Flags
We have to address the elephant in the room: the Trustpilot ratings. Currently, Zacks sits at a 1.6 to 1.8 out of 5 stars. That’s… not great.
When you dig into the Zacks Investment Research Reviews 144 – Trustpilot, most of the anger isn’t actually about the stock picks. It’s about the business practices. Common complaints include:
- Difficulty Canceling: Many users report having to call a phone line and sit through a “retention pitch” just to stop their subscription.
- Aggressive Upselling: Once you’re in for $249, you’ll get frequent emails asking you to upgrade to the $2,995 “Ultimate” tier.
- Billing Issues: Some users have reported being charged after they thought they had canceled.
While the math behind the rank is solid, the customer service side of the business seems to be stuck in 1995.
Subscription Tiers and Value Analysis
Zacks offers several ways to access their data, ranging from “free” (which is mostly just teaser content) to “prohibitive.”
- Zacks Premium ($249/year): This is the sweet spot for most. It gives you the full #1 Rank list, the Focus List (50 long-term stocks), and the Earnings ESP filter.
- Zacks Investor Collection ($495/year): This adds curated “real-time” portfolios like Stocks Under $10 and Home Run Investor.
- Zacks Ultimate ($2,995/year): This gives you every single thing they produce. Unless you are managing a multi-million dollar portfolio, this is likely overkill.
For a deeper dive into the high-end costs, check out the Zacks Ultimate Lifetime Price breakdown.
Is the Premium Service Worth the Cost in 2026?
In 2026, the “information edge” has narrowed. Back in the 80s, Len Zacks was the only one with this data. Today, everyone from your local bank to free apps tracks earnings revisions.
However, we believe the Focus List and the Style Scores (where stocks get an A-F grade for Value, Growth, and Momentum) still provide significant value. The Focus List, in particular, is great for people who don’t want to trade every day. It features 50 stocks selected for a longer-term horizon with a low annual turnover of about 20%.
If you’re still on the fence, we recommend reading Is Zacks Investment Research Worth Paying For? to see how it fits into a modern 2026 portfolio.
Frequently Asked Questions about Zacks Investment Research
How often is the Zacks Rank updated?
The rank is recalculated daily. Every morning, the system processes new analyst reports and revisions from the previous day. This means a stock could be a #1 Strong Buy on Tuesday and drop to a #3 Hold on Wednesday if an analyst changes their mind.
Is the Zacks Rank better for long-term or short-term investing?
The core Zacks Rank is designed for a 1 to 3-month horizon. It is a momentum-based system. If you are looking for stocks to hold for 10 years without checking your account, the Rank might frustrate you with its frequent changes. For long-term ideas, look at the Zacks Focus List instead.
What is the difference between Zacks Rank and Zacks Recommendation?
The Zacks Rank is 100% mathematical and based on earnings revisions. The Zacks Recommendation is a 6 to 12-month outlook that includes human analyst input, valuation, and industry trends. Think of the Rank as “what’s happening now” and the Recommendation as “what’s the long-term potential.”
Conclusion
At Smart Money & Tech Tips for Americans, we believe in using every tool available to gain an edge. Zacks Investment Research offers one of the most powerful quantitative engines on the market. If you are an active investor who isn’t afraid to do a little “filtering” and you have the discipline to follow a system, the $249/year for Premium is a bargain compared to the potential outperformance.
However, if you hate aggressive marketing emails and want a “set it and forget it” strategy, the Zacks “firehose” might just give you a headache.
Our Final Verdict: Use the 30-day free trial. Test the ESP filter. But keep a close eye on your subscription settings!
For a final summary, check out Is Zacks Investment Worth the Cost a Quick Answer? to see if it aligns with your personal finance goals. Happy investing!


