


Introduction
The standard formula for calculating net profit margin is:
$$\text{Net Profit Margin (\%)} = \left(\frac{\text{Net Income}}{\text{Total Revenue}}\right) \times 100$$
This core metric measures the percentage of each dollar of revenue that translates into final profit after deducting all operational, financial, and tax costs. When evaluating any enterprise, looking at gross revenue alone tells only half the story. A company can generate impressive sales volume while simultaneously sliding into bankruptcy if expenses outpace revenue. The true test of financial sustainability is bottom-line profitability: how effectively an organization turns top-line sales into actual earnings retained in the bank.
To evaluate this sales conversion efficiency, financial analysts and business owners rely on the income statement waterfall. Revenue flows through a series of expense deductions—direct production costs, operational overhead, financing debt service, and corporate taxes—before arriving at final net earnings.
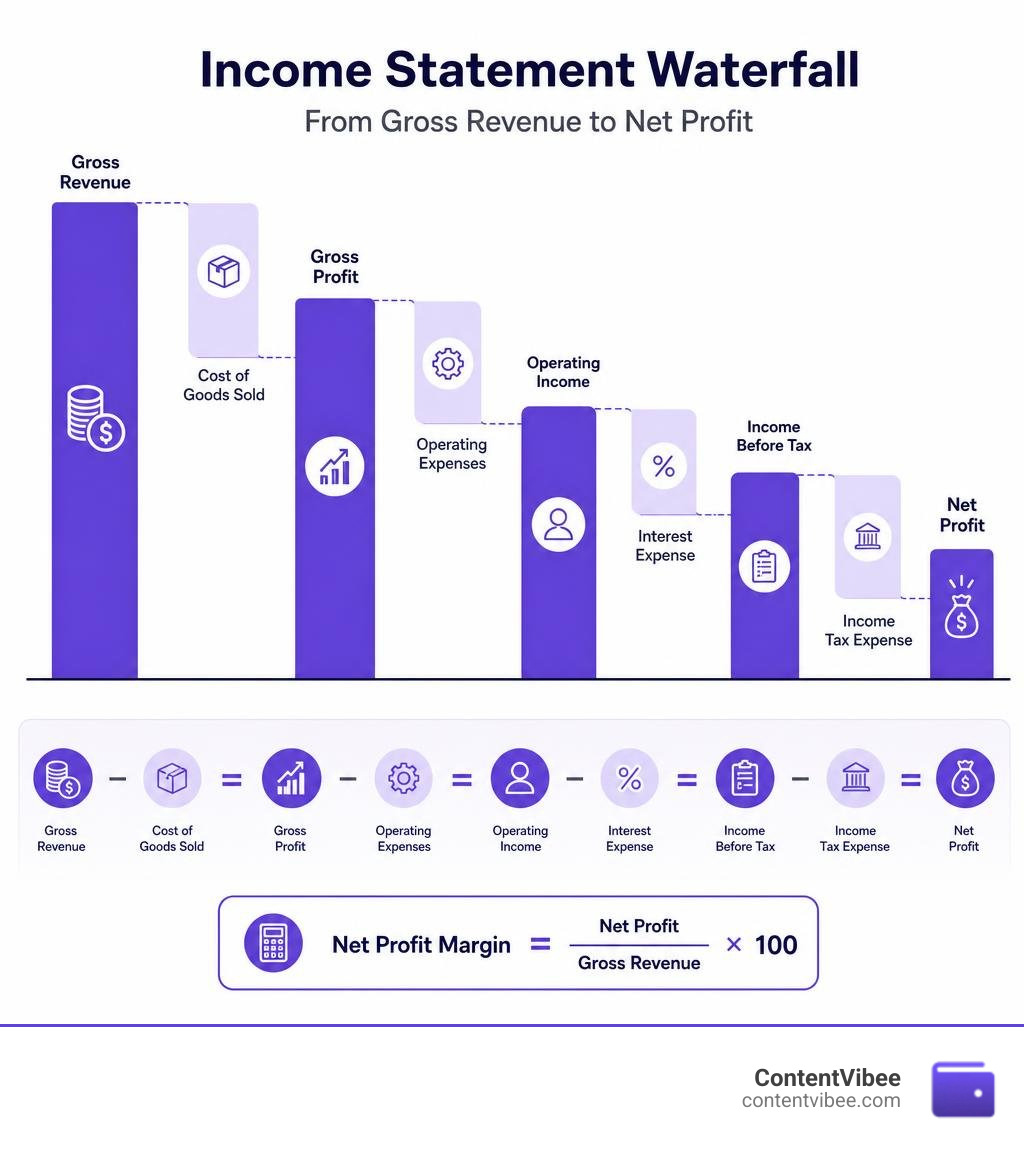
Understanding the Core Formula for Calculating Net Profit Margin
Net profit margin is the ultimate bottom-line metric. It expresses a company’s final net income as a clear earnings percentage of its total revenue, demonstrating what portion of each dollar earned survives as distributable profit. Finding The Easiest Way to Calculate Profit Margin begins with mastering this relationship:

Mathematically, the relationship is expressed as:
$$\text{Net Profit Margin (\%)} = \left(\frac{\text{Net Income}}{\text{Total Net Revenue}}\right) \times 100$$
Alternatively, when derived directly from an expanded income statement:
$$\text{Net Profit Margin (\%)} = \left(\frac{\text{Revenue} – \text{COGS} – \text{Operating Expenses} – \text{Interest} – \text{Taxes}}{\text{Revenue}}\right) \times 100$$
For deeper background on this foundational financial metric, review Understanding Net Profit Margin: Definition, Formula, and Analysis or consult comprehensive calculation frameworks via Net Profit Margin: Formula, Examples, Calculate – AccountingPedia.
Components Required in the Formula for Calculating Net Profit Margin
To compute an accurate net profit margin, you must gather several distinct line items from the income statement:
- Net Revenue (Top Line): Gross sales receipts minus customer returns, allowances, and promotional discounts.
- Cost of Goods Sold (COGS): Direct costs tied directly to the production of goods or delivery of services (such as raw materials, direct factory labor, and hosting infrastructure). Explore our guide on Gross Margin Cost Demystified for Small Businesses for details on structuring unit production costs.
- Operating Expenses (OPEX): Indirect costs necessary to run the business, including sales and marketing (SG&A), administrative salaries, office rent, software subscriptions, and depreciation of physical assets.
- Interest Expense: Debt servicing costs incurred on business credit lines, mortgages, or corporate bonds.
- Corporate Taxes: Federal, state, and local income tax obligations.
- Non-Operating Items: One-time legal settlements, gains or losses on foreign exchange, or asset sales.
Step-by-Step Breakdown: Applying the Formula for Calculating Net Profit Margin
Let us walk through a practical financial scenario step-by-step:
- Gross Sales Revenue: $1,250,000
- Returns & Discounts: $50,000
- Cost of Goods Sold (COGS): $400,000
- Operating Overhead (OPEX): $450,000
- Interest on Business Loans: $30,000
- Income Taxes: $70,000
In this case, the enterprise maintains a 20.83% net profit margin, retaining roughly 21 cents of clear profit from every sales dollar collected. To automate these mathematical deductions quickly across different reporting periods, use the Net Profit Margin Calculator — Revenue, COGS, OPEX, Tax or explore interactive modeling with the Net Profit Margin Calculator | Xero.
Net Profit Margin vs. Gross Margin, Operating Margin, and EBITDA
Financial analysis relies on a multi-tiered hierarchy of profitability margins. Each layer strips away specific operational or capital expenses to diagnose distinct aspects of business performance:
| Profitability Metric | Primary Formula | What It Measures | Excluded Expense Categories |
|---|---|---|---|
| Gross Profit Margin | $\frac{\text{Revenue} – \text{COGS}}{\text{Revenue}} \times 100$ | Direct unit production efficiency | OPEX, Debt Interest, Corporate Taxes |
| Operating Margin (EBIT) | $\frac{\text{Operating Income}}{\text{Revenue}} \times 100$ | Core operational efficiency | Non-operating items, Interest, Taxes |
| EBITDA Margin | $\frac{\text{EBITDA}}{\text{Revenue}} \times 100$ | Pure cash-generation efficiency | Non-cash D&A, Interest, Taxes |
| Net Profit Margin | $\frac{\text{Net Income}}{\text{Revenue}} \times 100$ | Total bottom-line earnings retained | None (Captures all expenses) |
To gain a granular look at unit production calculations, review How to Calculate Gross Profit Rate Without Losing Your Mind.
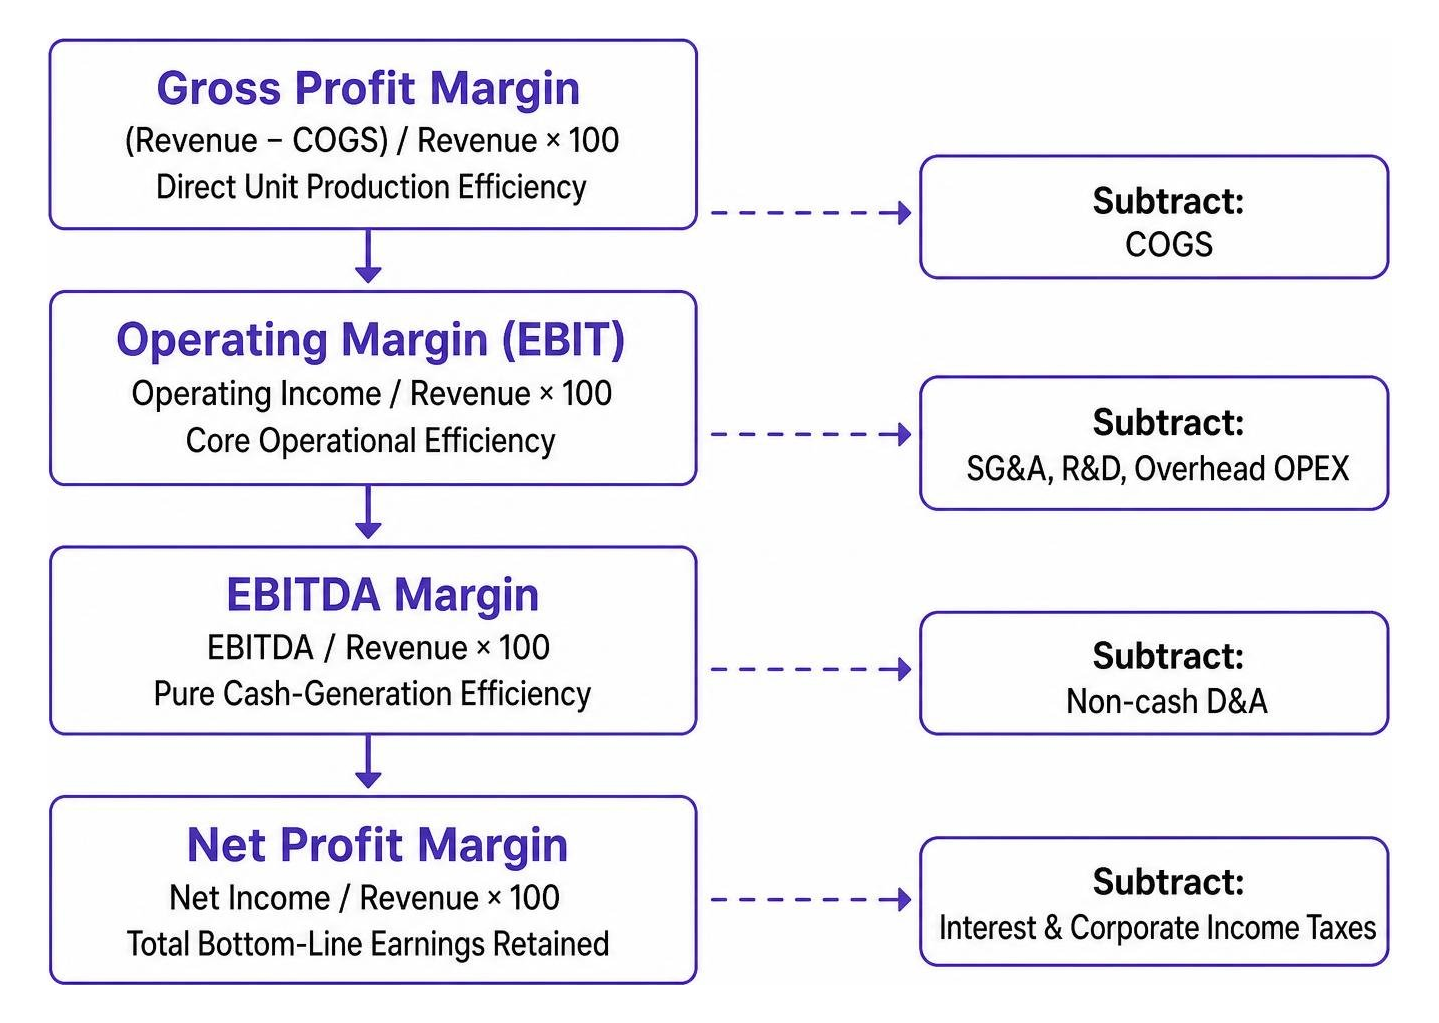
Gross Profit Margin vs. Net Profit Margin
Gross profit margin isolates direct production efficiency—such as factory labor and raw material costs—from all commercial overhead. A business might boast a high 70% gross profit margin on paper, yet struggle with cash flow if bloated executive payroll, aggressive marketing spend, and heavy debt servicing pull its net profit margin down to 3%.
For retail and e-commerce brands, understanding this divergence prevents overspending on customer acquisition. Check out The No-Nonsense Guide to Figuring Margin Percentage and Boosting Sales for practical tips on balancing production markups against operational spending.
Operating Margin and EBITDA vs. Net Margin
Operating Margin (Earnings Before Interest and Taxes, or EBIT) reveals how efficiently management operates the business model without the distortion of debt financing or regional corporate tax differences. Similarly, EBITDA margin strips away non-cash depreciation and amortization to show baseline operating cash conversion.
In contrast, net profit margin reflects the actual cash that can be distributed to equity holders or retained for business expansion. For instance, consider two competing firms that each achieve a 20% operating margin on $100 million in revenue:
- Company A is debt-free and operates in a 20% tax jurisdiction, leaving it with a 16.0% net profit margin ($16 million net income).
- Company B carries heavy debt requiring $20 million in annual interest payments, pulling its net income to $0 and resulting in a 0.0% net profit margin.
Using tools like the Net Profit Margin Calculator — See True Profitability helps isolate whether a margin shift is driven by day-to-day operations or by capital structure decisions.
Practical Business Examples and Industry Benchmarks
Because cost structures vary widely across industries, acceptable profit margins depend heavily on the sector:

Benchmarking against direct sector peers is critical; what represents exceptional profitability in grocery retail would signal financial distress in enterprise software. See Is Your Business Making Enough? The Ultimate Guide to Average Profit Margins for a complete breakdown of cross-industry standards.
Enterprise Tech and High-Margin SaaS Examples
Software and digital tech businesses benefit from low marginal reproduction costs. Once enterprise software code is developed, deploying it to additional users requires minimal direct cost, leading to elevated margins across the board:
- System & Application Software: Average gross margins reach 72.38%, supporting healthy net profit margins between 15% and 25%.
- Information Services: Typically average 13.4% net profit margins.
- Enterprise Case Studies: Tech leaders demonstrate massive economies of scale. In fiscal periods, Apple converted its hardware and services ecosystem into a 25.9% net profit margin, while Microsoft recorded a 37.7% net profit margin ($24.7 billion net income on $65.6 billion revenue).
To evaluate these high-margin software frameworks, see our guide on How to Master the Margin Formula Without Losing Your Mind.
High-Volume, Thin-Margin Sectors: Retail, Dining, and Airlines
Conversely, asset-heavy, labor-intensive, and commodity-based industries operate on tighter margins, relying on high transaction volume to generate total dollar returns:
- Grocery & Hardware Retail: Characterized by razor-thin net margins of 1% to 3%.
- Restaurants & Food Service: Average net profit margins between 3% and 9%, where high food costs, utilities, and kitchen wages absorb gross profits.
- Airlines & Capital Transport: Highly sensitive to fuel price fluctuations and heavy maintenance schedules. Major commercial carriers operated on average net margins of just 3.8%, barely covering operational overhead per seat sold.
- Shipbuilding & Heavy Manufacturing: Highly cyclical sectors where average net margins can drop to -1.8% during economic downturns.
For digital stores managing inventory carrying costs, using an Ecommerce Profit Calculator: Calculate Ecommerce Profit helps maintain bottom-line visibility across fluctuating shipping and wholesale expenses.
Strategic Levers to Improve Low or Negative Net Profit Margins
When evaluating your business model, ask yourself: Is Your E-commerce Business Making a Profit or Just Burning Cash? Expanding net profit margins typically requires working with four operational levers:
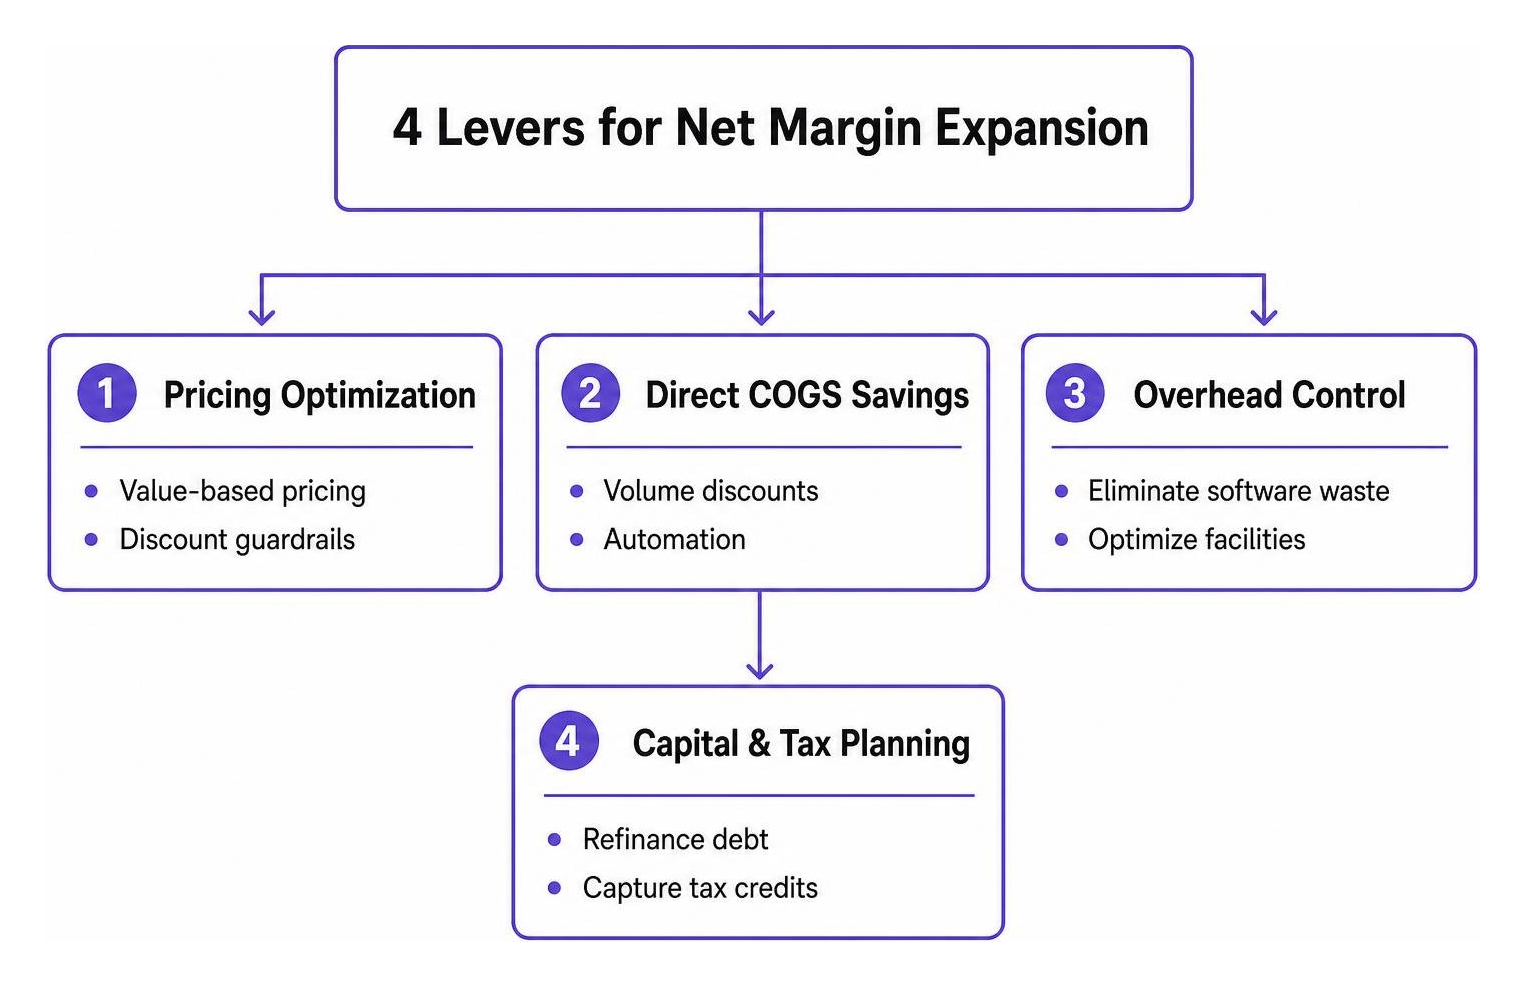
- Value-Based Pricing: Moving away from basic cost-plus markups toward value pricing directly lifts revenue without increasing variable costs.
- Discount Governance: Establishing strict approval floors on sales discounts prevents sales teams from eroding transaction margins.
- COGS Optimization: Renegotiating volume supplier agreements and reducing scrap rates lowers per-unit production costs.
- Overhead Rationalization: Auditing recurring subscriptions, consolidating facilities, and improving workflow productivity to rein in fixed SG&A expenses.
- Debt Refinancing & Tax Strategy: Lowering interest rates on credit lines and claiming applicable research and development tax credits directly protects net income.
Drivers of Margin Expansion and Compression
Tracking margin trajectories over 4 to 8 consecutive quarters helps pinpoint the root causes of financial changes:
- Margin Expansion Triggers: Economies of scale, favorable supply contracts, product mix shifts toward higher-margin software or services, and falling debt interest rates.
- Margin Compression Triggers: Unchecked overhead growth, aggressive price-discount wars, unexpected supplier price increases, or rising loan interest payments.
You can verify these shifts using our Net Profit Margin Calculator – Accurate Online Financial Ratio Tool.
Common Pitfalls and Analyzing Negative Net Margins
When running net profit margin analyses, avoid these common accounting mistakes:
- Using Gross Instead of Net Revenue: Failing to deduct customer returns and promotional rebates inflates the denominator, resulting in an artificially low margin percentage.
- Overlooking One-Off Distortions: Non-recurring items—such as factory restructuring fees or one-time legal settlements—can temporarily suppress net margin. Normalized net margin should be calculated by removing unusual events to assess recurring operational health.
- Confusing Margin with Absolute Dollar Scale: A boutique service firm with a 25% net margin on $400,000 revenue generates $100,000 in take-home profit. A scaled logistics firm operating at a 5% net margin on $50,000,000 revenue generates $2,500,000 in bottom-line cash. Percentage efficiency must always be viewed alongside overall business scale.
- Mishandling Early-Stage Losses: High-growth startups often report negative net margins due to large upfront investments in customer acquisition and product development. While common early on, management must ensure unit economics support positive margins once growth stabilizes.
Financial professionals can review our Margin Calculator for Accountants: Stop Undercharging and Start Multiplying Your Profits to streamline these balance sheet adjustments.
Frequently Asked Questions About Profit Margin Calculations
What is considered a good net profit margin across most industries?
As a general rule of thumb, net profit margins above 10% are considered healthy across the broader economy, while margins exceeding 20% represent high operational efficiency. However, realistic expectations depend on your sector: a 4% margin is solid for a wholesale grocer, whereas a software company should typically aim for 20% or higher.
Can a company’s net profit margin be negative, and what does it indicate?
Yes. A negative net profit margin occurs whenever total expenses (COGS, OPEX, interest, and taxes) exceed total revenue for the period, resulting in a net accounting loss. This is standard for venture-backed startups investing heavily in expansion, but in mature companies, it points to pricing pressure, declining sales volume, or unmanaged fixed overhead.
How do owner draws versus formal salaries affect small business net margins?
In sole proprietorships and single-member LLCs, owners often take profits as personal draws rather than running formal payroll. Because owner draws occur after net profit is calculated, the company’s net margin can appear artificially high. For incorporated businesses where owners receive a W-2 salary, that compensation is recorded under OPEX, reducing reported net income. To evaluate peer businesses fairly, owner compensation should always be normalized.
Conclusion
At ContentVibee, we focus on helping you look beyond top-line revenue to build sustainable, highly profitable businesses. Calculating your net profit margin connects your sales performance directly to bottom-line financial reality, showing exactly how much cash remains after paying suppliers, staff, lenders, and tax authorities.
Consistently tracking your net profit margin across multi-quarter windows helps you spot margin compression early, manage overhead, and protect your bottom line. To streamline your ongoing financial analysis, explore our guide: Stop Eyeballing It: Excel Add Margin Formulas Made Easy to build automated profitability tracking directly into your daily spreadsheets.


