


ET vs Enbridge Investment Dividend Yield and Risk Comparison is one of the most searched topics among income investors looking for high-yield pipeline stocks — and for good reason. These two midstream giants sit at very different points on the risk-reward spectrum.
Here’s the quick answer most investors are looking for:
| Metric | Energy Transfer (ET) | Enbridge (ENB) |
|---|---|---|
| Dividend Yield (TTM) | ~7.20% | ~5.96% |
| Dividend Streak | Cut in 2020 | 30 consecutive years of increases |
| Sharpe Ratio | 0.82 | 1.55 |
| Max Drawdown | -87.81% | -46.35% |
| 10-Year Annualized Return | 1.90% | 4.56% |
| Market Cap | ~$59-68B | ~$97-117B |
| Forward P/E | ~10.7x | ~21.5x |
| Volatility (Daily Std Dev) | 27.54% | 16.68% |
The short version:
- ET offers a higher yield but comes with significantly more risk and volatility
- ENB offers a lower yield but has far stronger risk-adjusted returns and dividend reliability
Both are midstream energy companies with fee-based pipeline infrastructure. But they are not equally safe for dividend-focused investors.
This guide breaks down every metric that matters — yield, safety, growth, valuation, and risk — so you can make a clear, informed decision.
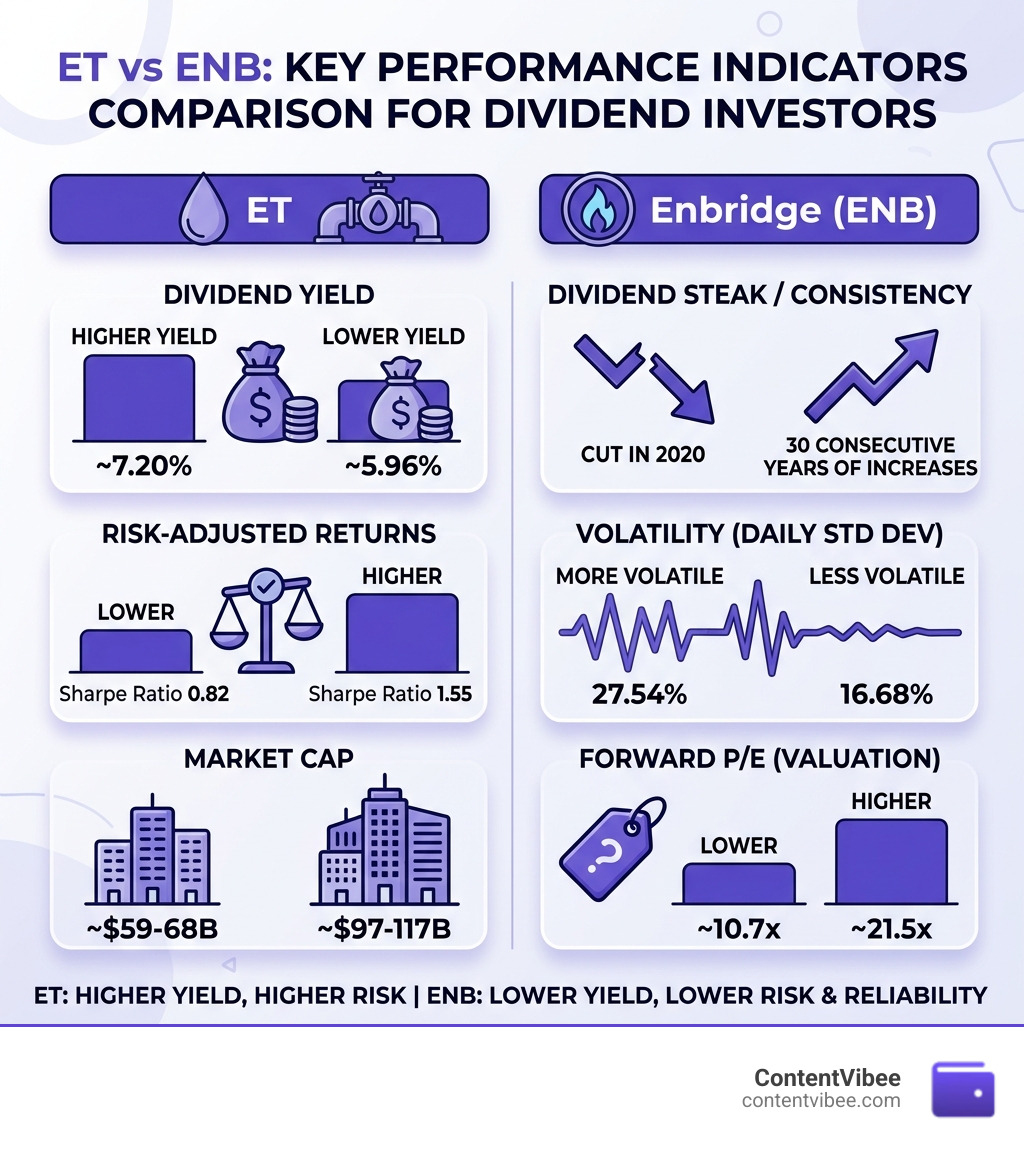
Dividend Yield and Reliability Analysis
When we look at the raw numbers in April 2026, Energy Transfer (ET) initially looks like the clear winner for income seekers. With a trailing twelve-month (TTM) dividend yield ranging between 6.7% and 7.20%, it offers a significant premium over Enbridge (ENB), which sits between 5.96% and 6.2%. However, as any seasoned investor knows, yield is only half the story; reliability is the other half.
Enbridge is a titan of consistency. It has increased its dividend every year for 30 consecutive years, earning it a reputation as a bedrock for conservative portfolios. On the flip side, Energy Transfer has a more turbulent history. During the 2020 pandemic, ET made the difficult decision to cut its distribution in half to preserve cash and strengthen its balance sheet. While ET has since been aggressive in raising its payout back to (and beyond) pre-pandemic levels, that cut remains a fresh memory for many.
For those weighing a Better Dividend Stock: Enbridge vs. Energy Transfer, the choice often boils down to a preference for current high income versus long-term peace of mind. Enbridge’s 30-year streak suggests a management culture that prioritizes the dividend above almost all else, whereas ET’s management has shown they will prioritize the company’s financial structure over the immediate payout if the market turns sour.
ET vs Enbridge Investment Dividend Yield and Risk Comparison: Which Yield is Safer?
Safety is often measured by payout ratios and the stability of cash flows. Both companies operate on a “fee-based” model, meaning they act like toll roads for energy. They get paid based on the volume of oil and gas moving through their pipes, not necessarily the price of the commodities themselves.
Enbridge’s yield is supported by its massive diversification. Following its major acquisitions in late 2023 and 2024, it has become the largest natural gas utility provider in North America. This utility-like income is incredibly stable. ET, while also fee-based, has a more aggressive growth-by-acquisition strategy. This often leads to higher debt levels, which can put pressure on the dividend during economic downturns.
When we consider Why the Investment Time Horizon Impact matters, ET may appeal to those needing high immediate cash flow today, while ENB is almost certainly the safer bet for those looking 10 or 20 years into the future. Analysts currently project that ENB will continue its 3-5% annual dividend growth, while ET’s growth may be more lumpy as it balances acquisitions with distributions.
ET vs Enbridge Investment Dividend Yield and Risk Comparison: Financial Metrics
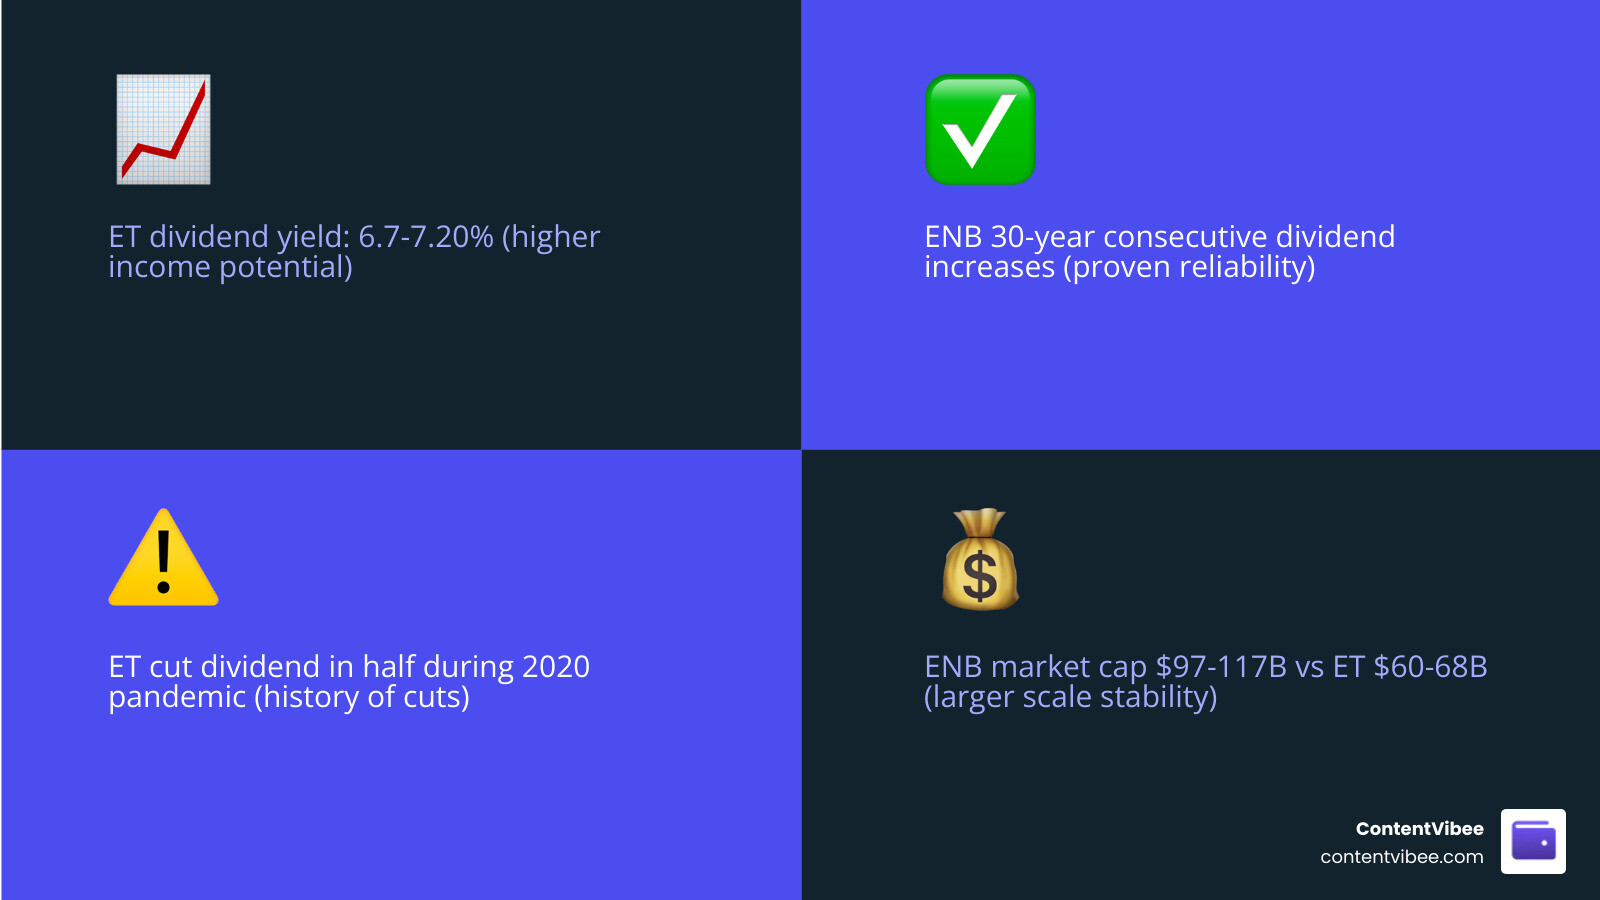
To truly understand these companies, we have to look under the hood at their balance sheets. As of April 2026, Enbridge commands a significantly larger market presence with a market cap between $97.54B and $117.53B. Energy Transfer is smaller but still massive, valued between $59.85B and $68B.
The valuation gap is where things get interesting. ET is currently trading at a forward P/E of roughly 10.7x to 13.21x, which is remarkably cheap compared to Enbridge’s 21.5x to 22.97x. This suggests that the market views Enbridge as a “quality” stock deserving of a premium, while ET is priced as a “value” play with higher perceived risks.
For a deeper dive into how these fit into a broader portfolio, see our guide on Understanding Traditional vs Alternative Investments.
Valuation and Total Return Performance
If you had invested $10,000 in both stocks ten years ago, the results would be starkly different. Enbridge has delivered a 10-year annualized return of 4.56%, while Energy Transfer has struggled with an annualized return of just 1.90%. This highlights a critical lesson: a higher dividend yield does not always lead to higher total returns if the share price languishes or drops.
In the short term, the trend has shifted slightly. YTD returns for ET have been under pressure at -4.83%, while Enbridge has shown resilience with a 6.62% gain. ET’s Price-to-Sales (P/S) ratio of 0.82x makes it look like a bargain compared to Enbridge’s 2.87x, but investors must ask themselves if they are buying a “value trap” or a “coiled spring.”
Risk Profiles and Volatility Assessment
Risk is where the ET vs Enbridge Investment Dividend Yield and Risk Comparison becomes most lopsided. If you have a low stomach for volatility, Energy Transfer might give you heartburn.

ET’s daily standard deviation (a measure of how much the price bounces around) is 27.54%. Compare that to Enbridge’s much calmer 16.68%. Furthermore, ET’s maximum drawdown — the biggest drop from a peak to a trough — is a staggering -87.81%. Enbridge’s maximum drawdown is a more manageable -46.35%. This data suggests that while ET can provide massive gains during energy booms, it can also lose nearly all its value during a crash.
Proper Investment Asset Allocation Strategy Risk Management suggests that ET should likely be a smaller “satellite” position in a portfolio, whereas ENB could serve as a “core” holding.
ET vs Enbridge Investment Dividend Yield and Risk Comparison: Risk-Adjusted Returns
To compare these fairly, we use the Sharpe and Sortino ratios. These metrics tell us how much “reward” an investor gets for every unit of “risk” they take.
- Sharpe Ratio: ET 0.82 vs. ENB 1.55 (Higher is better)
- Sortino Ratio: ET 1.22 vs. ENB 2.17 (Higher is better)
Enbridge nearly doubles ET’s performance on a risk-adjusted basis. This is further backed by the Ulcer Index, which measures the “stress” of holding a stock. ET has an Ulcer Index of 7.60, while ENB sits at a much more comfortable 3.12. If you are looking for What is the Safest Investment?, neither of these stocks qualifies as “safe” like a Treasury bill, but Enbridge is clearly the safer of the two.
Business Models and Future Growth Outlook
The two companies are moving in slightly different directions. Enbridge is aggressively pivoting toward the “energy transition.” They are investing heavily in renewable energy and natural gas utilities, betting that even as oil demand eventually wanes, the world will still need electricity and heat. This makes Enbridge a more “future-proof” investment for the next several decades.
Energy Transfer, meanwhile, remains a powerhouse in traditional oil and gas midstream. They focus on being the most efficient mover of hydrocarbons in the United States. While they are exploring carbon capture and other green initiatives, their core remains firmly planted in the fossil fuel infrastructure of today. This is explored further in Enbridge vs. Energy Transfer: A Dividend Showdown – AInvest.
Strategic Diversification and Regulatory Risks
Enbridge’s operations span both the U.S. and Canada, which exposes them to two different sets of regulatory environments. While this provides geographic diversification, it also means they have to navigate complex cross-border politics (like the ongoing discussions regarding Line 5).
Energy Transfer is primarily focused on the U.S. market. While this simplifies their regulatory landscape, it also means they are more sensitive to U.S.-specific policy changes. For 2026, analysts project EBITDA growth of roughly 17% for Enbridge, largely driven by their recent utility acquisitions, compared to a more modest 5% for Energy Transfer.
Frequently Asked Questions about ET and Enbridge
Why did Energy Transfer cut its dividend in 2020?
Energy Transfer cut its distribution by 50% in October 2020 to accelerate debt reduction and fund capital expenditures internally. At the time, the company wanted to maintain its investment-grade credit rating during the extreme uncertainty of the COVID-19 pandemic.
Is Enbridge a Dividend Aristocrat?
While the term “Dividend Aristocrat” usually refers to S&P 500 companies with 25+ years of increases, Enbridge is frequently treated as one by Canadian investors and income specialists. With 30 consecutive years of dividend growth, it meets the spirit of the title, even if it is technically a “Dividend Giant” in the midstream space.
Which stock has better risk-adjusted returns for 2026?
Based on the Sharpe Ratio (1.55 vs 0.82) and Sortino Ratio (2.17 vs 1.22), Enbridge offers significantly better risk-adjusted returns. It provides more consistent performance with less “downside” volatility than Energy Transfer.
Conclusion
Choosing between ET and Enbridge depends entirely on your personal investment goals. If you are a “yield chaser” who can handle extreme price swings and a history of dividend cuts in exchange for a 7% payout, Energy Transfer is priced attractively.
However, for most long-term investors, Enbridge appears to be the superior choice. It offers a lower but still very healthy ~6% yield, backed by 30 years of growth, lower volatility, and a business model that is actively preparing for the green energy transition.
At ContentVibee, we believe in looking beyond the headline yield to find the true value of an investment. Whether you prefer the high-octane potential of ET or the steady-eddie nature of Enbridge, automated portfolio management can help you maintain the right balance. For more in-depth analysis, check out our More info about investment reviews to see how we evaluate the cost-worthiness of today’s top assets.


