


How Much Can You Safely Spend in Retirement? The 4% Rule Explained
A 4 percent retirement withdrawal calculator is one of the most practical tools you can use to answer a question that keeps many near-retirees up at night: Will my money last as long as I do?
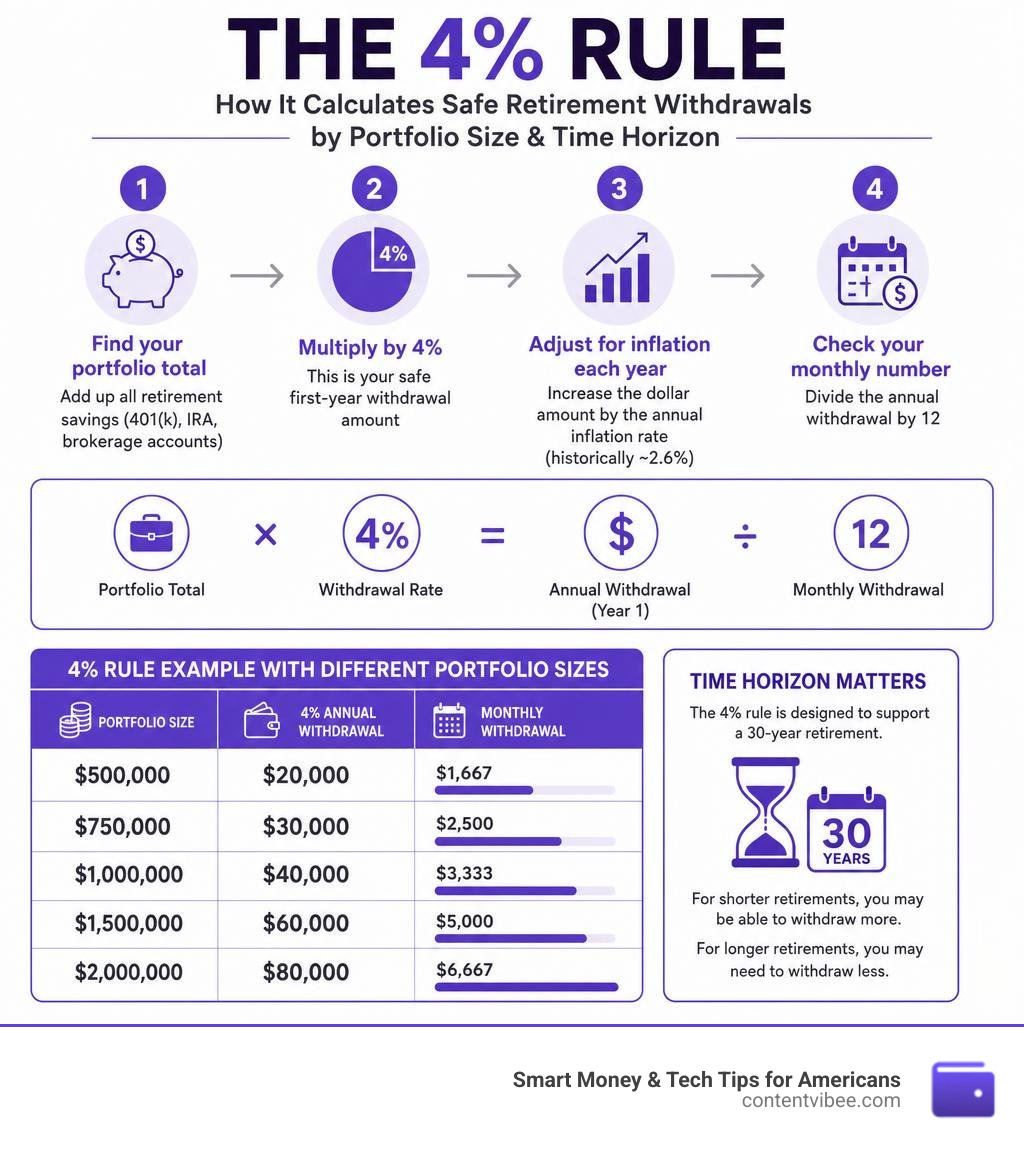
Quick Answer: How the 4% Rule Works
- Find your portfolio total — add up all retirement savings (401(k), IRA, brokerage accounts)
- Multiply by 4% — this is your safe first-year withdrawal amount
- Adjust for inflation each year — increase the dollar amount by the annual inflation rate (historically ~2.6%)
- Check your monthly number — divide the annual withdrawal by 12
Example:
| Portfolio Size | 4% Annual Withdrawal | Monthly Withdrawal |
|---|---|---|
| $500,000 | $20,000 | $1,667 |
| $750,000 | $30,000 | $2,500 |
| $1,000,000 | $40,000 | $3,333 |
| $1,500,000 | $60,000 | $5,000 |
| $2,000,000 | $80,000 | $6,667 |
The rule is backed by decades of real market data. Researcher William Bengen analyzed every rolling 30-year retirement period going back to 1926 — including the Great Depression — and found that a 4% initial withdrawal, adjusted annually for inflation, survived every single period in the historical record. The Trinity Study later confirmed a roughly 95% success rate for 30-year retirements on a balanced stock-and-bond portfolio.
That said, the 4% rule is a starting point, not a guarantee. Your retirement length, spending habits, tax situation, and market conditions all affect how the math plays out for you personally.
Understanding the 4 Percent Retirement Withdrawal Calculator and How It Works
At its core, a 4 percent retirement withdrawal calculator is a planning tool designed to simulate how your accumulated nest egg will behave over a multi-decade retirement. Instead of forcing you to manually calculate complex formulas or guess how long your savings will last under different market conditions, the calculator does the heavy lifting for you.
The calculator works by taking a few fundamental variables—such as your total portfolio size, your desired initial withdrawal rate, expected investment returns, and projected inflation—and projecting the survival rate of your assets. By modeling these factors together, it helps you visualize whether your savings will grow, hold steady, or deplete before your target horizon.
For many Americans, planning a retirement budget can feel like trying to hit a moving target. Market volatility, rising healthcare costs, and shifting economic cycles make a static spreadsheet highly unreliable. By utilizing a dynamic tool like our Smart Money Finance Calculator, you can establish a reliable baseline. This allows you to test various market environments and adjust your expectations before you make the leap into your golden years.
The Mechanics of the 4% Rule: Determining Safe Annual Withdrawals
Understanding the mechanics of the 4% rule is crucial to using a 4 percent retirement withdrawal calculator effectively. The rule does not mean you simply take 4% of whatever your portfolio is worth at the end of every year. Doing so would cause your annual spending to fluctuate wildly based on stock market performance—leaving you with plenty of cash during bull markets but forcing you to cut your budget to the bone during downturns.
Instead, the classic 4% rule is all about establishing a stable, predictable stream of income. Here is the step-by-step mechanics of how it actually works:
- Year 1 (The Baseline): You calculate 4% of your total portfolio value on the day you retire. This dollar amount becomes your initial withdrawal for your first year of retirement.
- Year 2 and Beyond: You ignore the current balance of your portfolio. Instead, you take your Year 1 withdrawal amount and increase it by the rate of inflation. This ensures your annual spending power remains completely identical, protecting you from the rising costs of goods and services.
- Rinse and Repeat: You continue this process annually, adjusting the previous year’s dollar amount by the actual rate of inflation, regardless of whether the stock market went up or down.

This systematic approach removes emotion from the equation, giving you a clear roadmap for your annual spending. To see how these numbers align with your broader financial goals, you can test different scenarios using the Smart Money Finance Calculator.
How to Calculate Your Safe Annual and Monthly Withdrawal Amount
Let’s walk through a concrete example using a standard $1,000,000 portfolio to show how simple the math is.
- Determine the Initial Annual Withdrawal: Multiply your $1,000,000 portfolio by 4% (0.04). This gives you a safe annual withdrawal of $40,000 for your first year.
- Determine the Initial Monthly Withdrawal: To find your monthly budget, divide your annual withdrawal by 12. This gives you a monthly withdrawal of $3,333.
- Adjust for Inflation in Year Two: Let’s assume inflation over your first year of retirement was 3%. For your second year, you do not calculate 4% of your new portfolio balance. Instead, you multiply your Year 1 withdrawal ($40,000) by 1.03. Your new Year 2 annual withdrawal is $41,200 (or $3,433 per month).
While this portfolio income forms the bedrock of your retirement, it is only one piece of the puzzle. Most retirees will also receive Social Security or pension benefits. To see how your portfolio withdrawals will pair with federal benefits, you can Estimate Your Monthly Retirement Benefits In 5 Easy Steps to build a more comprehensive monthly income plan.
Key Inputs Required for a 4 Percent Retirement Withdrawal Calculator
To get the most accurate results from a retirement calculator, you need to understand the inputs it requires. A robust calculator typically asks for the following details:
- Portfolio Value: The combined balance of all your investment accounts, including Traditional IRAs, Roth IRAs, 401(k)s, and taxable brokerage accounts. We recommend excluding home equity or emergency cash reserves from this number.
- Expected Return: The average annual nominal return you expect your investments to generate. Historically, a balanced 60/40 stock/bond portfolio has returned around 5% to 7% nominally.
- Inflation Rate: The rate at which consumer prices rise annually. The average inflation rate in the United States over the past 30 years has been around 2.6% per year, making 2.5% to 3% a sensible baseline for calculations.
- Retirement Duration: The number of years you need your money to last. Traditional retirement planning typically assumes a 30-year horizon, but early retirees may need to plan for 40 or 50 years.
You can experiment with these inputs on the Smart Money Finance Calculator to find the sweet spot that works for your unique lifestyle.
The Core Assumptions and Historical Success of the 4% Rule
The 4% rule is highly regarded in the financial community because it is built on rigorous historical backtesting rather than optimistic guesswork. However, to trust the math, we must understand the core assumptions that underwrite its historical success.
The rule assumes a standard 30-year retirement horizon and a diversified portfolio consisting of U.S. stocks and bonds. Specifically, the original research tested asset allocations ranging from a 50/50 to a 75/25 stock/bond split. The rule assumes that the retiree maintains this allocation and rebalances periodically, allowing the stock portion to provide growth that outpaces inflation while the bond portion provides stability and income.

Historically, this asset mix has been incredibly resilient. By keeping at least 50% of the portfolio in equities, retirees have been able to harness historical U.S. returns to rebuild their principal even after major market downturns.
The Trinity Study and Historical Market Cycles
The origin of the 4% rule dates back to a landmark 1994 paper by financial planner William Bengen, followed by the highly influential 1998 “Trinity Study” conducted by three professors at Trinity University. These researchers set out to find the “SAFEMAX”—the maximum withdrawal rate that would prevent a portfolio from running out of money over any historical 30-year period.
They backtested various withdrawal rates against actual historical market data dating back to 1926. This data included some of the worst economic environments in American history, including:
- The Great Depression of 1929
- The stagflation crisis of the 1970s
- The dot-com crash of 2000
- The Great Recession of 2008
The findings were remarkable: a 4% annual withdrawal rate had a 95% to 96% success rate of lasting a full 30 years across all historical market cycles. In fact, in the vast majority of historical scenarios, retirees who followed the 4% rule actually ended their 30-year retirement with more money than they started with.
To integrate these historical success rates with other guaranteed income streams, you can explore the Best Free Social Security Calculator Options Your No Cost Retirement Roadmap to see how your portfolio withdrawals and government benefits can work hand-in-hand.
How Inflation Affects Your 4 Percent Retirement Withdrawal Calculator Results
Inflation is often described as the silent thief of retirement because it steadily erodes your purchasing power over time. If you do not adjust your withdrawals for inflation, a fixed budget that feels comfortable at age 65 will buy far less by the time you reach age 85 or 90. For example, at an average inflation rate of 2.6%, your purchasing power is cut nearly in half over a 30-year period.
A proper 4 percent retirement withdrawal calculator accounts for this by distinguishing between nominal returns (the raw growth of your investments) and real returns (your growth minus inflation).
Interestingly, real-world data offers some comfort. Research shows that the average retiree does not actually spend money in a perfectly linear, inflation-adjusted path. In fact, average retirees spend roughly 25% less in nominal terms with each progressive decade of retirement following age 65. As physical activity slows down, travel and dining budgets naturally decrease, which often offsets the rising costs of healthcare and general inflation.
Adjusting the Rule for Early Retirement (FIRE) and Longer Horizons
While the 4% rule is an excellent baseline for someone retiring at age 65, it requires serious adjustments for early retirees. The Financial Independence, Retire Early (FIRE) movement has popularized retiring in one’s 30s, 40s, or 50s. If you are planning for a retirement horizon that spans 40, 50, or even 60 years, the historical success rate of the 4% rule drops significantly.
Over a 50-year horizon, the historical success rate of a rigid 4% withdrawal rate drops from 95% to somewhere between 70% and 85%. This is because a longer timeline increases the probability of encountering a prolonged market downturn early in retirement, known as sequence of returns risk.
To counter this risk, prominent retirement researchers like Wade Pfau recommend that early retirees adopt a more conservative withdrawal rate of 3% to 3.5% (which equates to saving 28 to 33 times your annual expenses).
For those planning to leave the workforce early, utilizing tax-advantaged accounts is key. You can read about Demystifying The 457 Deferred Compensation Plan Your Golden Ticket To Early Retirement to see how certain plans allow penalty-free early withdrawals. Additionally, if you are planning your exit in the Golden State, check out our guide on When Can You Stop Working And Retire In California to understand local cost-of-living and tax factors.
Portfolio Longevity at Different Withdrawal Rates
To visualize how different withdrawal rates impact the lifespan of your retirement portfolio, consider this general breakdown of historical success and longevity:
| Withdrawal Rate | Portfolio Longevity (Years) | Risk Level | Best Suited For |
|---|---|---|---|
| 3.0% | Indefinite (50+ years) | Extremely Safe | Early retirees (FIRE), very conservative planners |
| 3.5% | 40 to 50 years | Safe | Mid-career retirees, long-term planning |
| 4.0% | 30 to 35 years | Moderate (Classic baseline) | Traditional retirees (age 65) |
| 4.5% | 20 to 25 years | Elevated Risk | Shorter horizons, flexible spenders |
| 5.0% | 15 to 20 years | High Risk | Very short horizons, high risk tolerance |
As the table illustrates, dropping your withdrawal rate to a conservative 3% virtually guarantees your money will last indefinitely, as your portfolio’s real return will likely equal or exceed your annual distributions. Conversely, pushing your rate to 5% or higher introduces a significant risk of running out of money within two decades.
Alternative Withdrawal Strategies vs. the Rigid 4% Rule
While the classic 4% rule is a fantastic mathematical model, its rigidity doesn’t always match the realities of human behavior. Most retirees do not want to blindly follow a mathematical formula if the market is crashing. Instead, they want to adapt.
Using a fixed-percentage withdrawal or dynamic spending strategy can offer greater safety and peace of mind. Let’s look at how alternative strategies compare to the rigid 4% rule.
To explore how these different withdrawal rates and strategies might alter your personal savings timeline, we encourage you to test your numbers on the Smart Money Finance Calculator. You can also cross-reference your results with other tools, such as the Mutual of Omaha Savings Calculator or the American Century Cash Out Calculator to gain a well-rounded view of your options.
Guardrails and Variable Percentage Withdrawal (VPW)
One of the most popular modern alternatives is the Guyton-Klinger Guardrails strategy. This approach allows you to start with a higher initial withdrawal rate (often 4.5% or 5%) but establishes strict rules for adjusting your spending based on market performance:
- The Prosperity Rule: If the market performs exceptionally well and your actual withdrawal rate drops significantly below your initial rate, you increase your spending to enjoy your wealth.
- The Capital Preservation Rule: If the market crashes and your current withdrawal rate rises 20% above your starting rate, you cut your spending by 10% to protect your remaining principal.
This spending flexibility dramatically reduces your sequence of returns risk—the danger of a market crash early in retirement permanently ruining your portfolio. By agreeing to cut back slightly during bad years, you can safely enjoy a higher standard of living during good years.
The Bucket Strategy and Rising Equity Glidepaths
Another highly intuitive approach is the Bucket Strategy. Instead of treating your retirement savings as one giant pool of money, you divide your assets into three distinct “buckets” based on when you will need to spend the cash:
- Bucket 1 (Short-Term): 2 to 3 years of living expenses held in cash, CDs, or ultra-safe money market funds. This is the cash you draw from for daily living, ensuring you never have to sell stocks during a market downturn.
- Bucket 2 (Medium-Term): 5 to 7 years of expenses held in conservative, income-producing assets like bonds, treasury notes, and dividend-paying stocks.
- Bucket 3 (Long-Term): The remainder of your portfolio invested in high-growth equities. This bucket has a 10+ year horizon to recover from market volatility.
Additionally, researchers like Wade Pfau and Michael Kitces have popularized the concept of a rising equity glidepath (or “bond tent”). This strategy involves entering retirement with a highly conservative asset allocation (e.g., 30% stocks, 70% bonds) to mitigate sequence risk during the first five years of retirement, and then gradually increasing your stock exposure back to 60% or 70% as you age.
Frequently Asked Questions about Safe Retirement Withdrawals
What is the difference between a fixed-percentage withdrawal and the classic 4% rule?
The classic 4% rule uses your initial portfolio value to set a fixed dollar amount, which is then adjusted only for inflation. Your actual withdrawals remain identical in terms of purchasing power, regardless of market performance.
In contrast, a fixed-percentage withdrawal strategy means you withdraw a constant percentage (e.g., 4%) of your remaining portfolio balance every single year. Under this strategy, you will never mathematically run out of money, but your annual income will experience extreme spending volatility. If your portfolio drops from $1,000,000 to $700,000 during a market crash, your annual income will immediately drop from $40,000 to $28,000.
What are the main risks not captured by a basic 4% calculator?
While a basic 4 percent retirement withdrawal calculator is an exceptional starting point, it operates in a simplified vacuum. Real life is rarely that neat. The primary risks it fails to capture include:
- Sequence of Returns Risk: If the stock market suffers a severe downturn in the first 3 to 5 years of your retirement, a basic calculator may overstate your portfolio’s longevity.
- Taxes: Most calculators model pre-tax withdrawals. If your savings are in a Traditional IRA or 401(k), every dollar you withdraw is taxed as ordinary income. You must plan your gross withdrawals to cover your net, after-tax spending needs.
- Healthcare and Long-Term Care Costs: Medical expenses are highly unpredictable and often spike dramatically in the final years of life.
- Lumpy Spending Patterns: Retirees rarely spend money at a perfectly flat rate. Spending is often “smile-shaped”—high in the early active years (travel, hobbies), lower in the middle years, and high again at the end of life due to healthcare.
To see how these variables might impact your overall investment returns, you can read our analysis on Is The Dave Ramsey Investment Calculator Accurate to better understand the limitations of simplified online calculators.
How can I use the 4% rule to set a retirement savings target?
You can easily reverse-engineer the 4% rule to calculate your “FIRE Number” or total retirement savings target using the 25x rule. Because dividing a number by 4% (0.04) is mathematically identical to multiplying it by 25, you can find your target nest egg with this simple formula:
$$\text{Annual Expenses} \times 25 = \text{Retirement Savings Target}$$
For example, if you estimate that you need $60,000 per year from your portfolio to live comfortably in retirement, your math is:
$$\$60,000 \times 25 = \$1,500,000$$
Using this simple shortcut, you can quickly establish a clear, tangible savings goal to work toward. For more detailed rules of thumb, you can also explore the resources available at Four Percent Rule | Safe Retirement Withdrawals.
Conclusion
At Smart Money & Tech Tips for Americans, we believe that financial freedom shouldn’t be a mystery. While the 4% rule is an incredibly powerful framework, it is ultimately a starting point for your personalized financial planning. No single rule of thumb can perfectly predict the future, but having a clear, data-backed strategy is the absolute best way to build a reliable retirement roadmap.
By combining historical frameworks with modern, flexible withdrawal strategies, you can step into retirement with complete confidence. Ready to take the next step and model your own path to financial independence? Spend a few minutes with our free Smart Money Finance Calculator to customize your numbers and secure your financial future today!