


Why a Tax Bracket Calculator Is the First Step to Predicting Your Tax Bill
A tax bracket calculator is a tool that estimates how much federal income tax you owe based on your income, filing status, and deductions. Here’s how it works at a glance:
| Step | What You Do |
|---|---|
| 1 | Enter your gross income |
| 2 | Choose your filing status (single, married, etc.) |
| 3 | Apply your standard or itemized deduction |
| 4 | The calculator applies each bracket rate to the matching slice of income |
| 5 | You get your estimated tax owed, marginal rate, and effective rate |
Here’s something most people get wrong: your tax bracket is not the rate you pay on all your income.
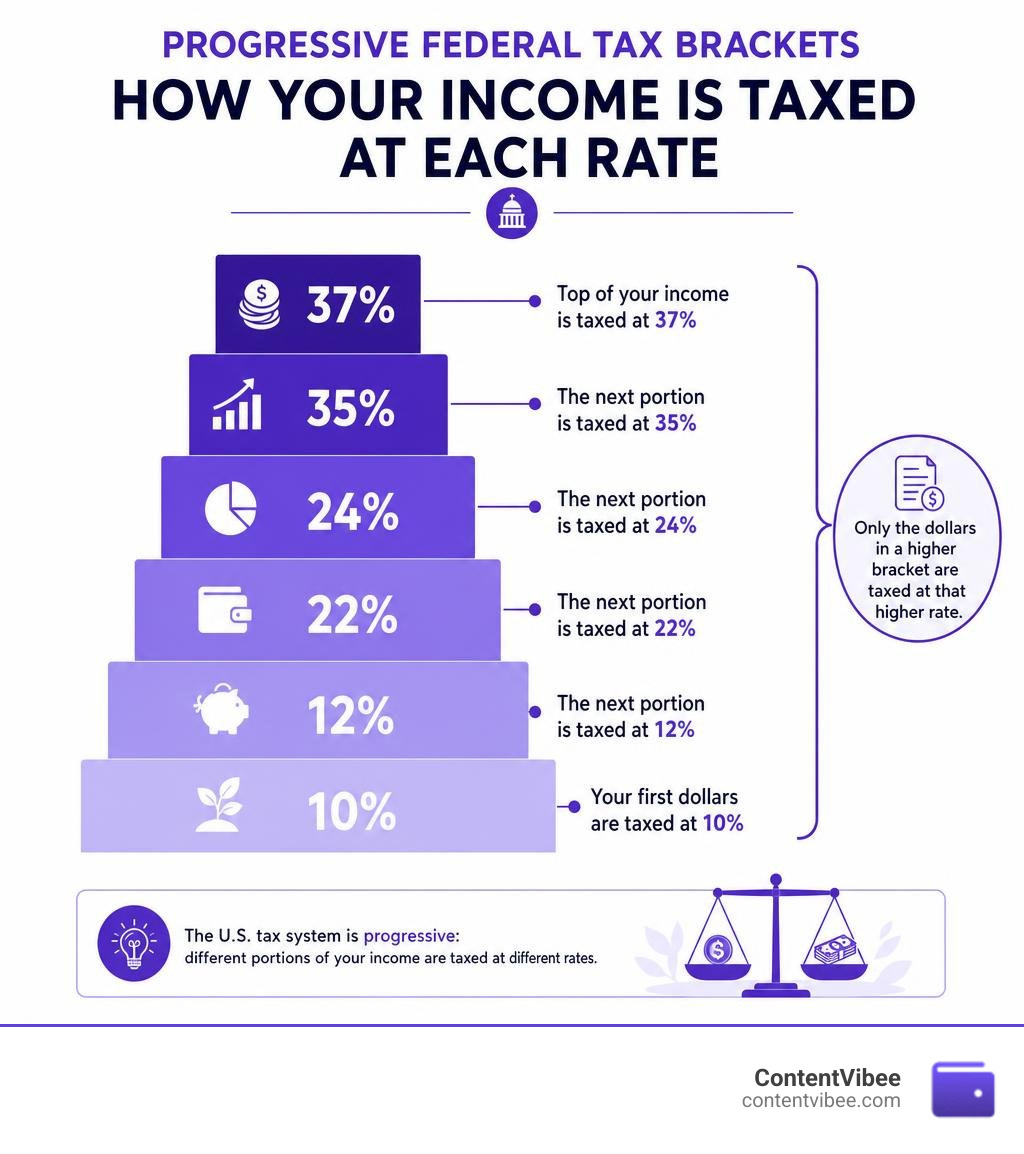
The U.S. uses a progressive tax system. That means your income is divided into chunks, and each chunk is taxed at a different rate. Only the dollars that land in a higher bracket get taxed at that higher rate — not every dollar you earned.
A real example makes this click fast. A single filer earning $50,000 in 2025 sits in the 22% bracket — but their actual federal tax bill is around $5,914. That works out to an effective rate of just 11.8%, because most of their income was taxed at 10% and 12% first.
For mid-career professionals thinking about a 403(b) rollover, Roth conversion, or retirement income strategy, this distinction is critical. A small change in taxable income can shift which bracket your next dollar falls into — and knowing that in advance lets you plan smarter.
Terms related to tax bracket calculator:
How U.S. Progressive Taxation Works
To understand why a tax bracket calculator is such a powerful addition to your financial planning toolkit, we first have to demystify how the U.S. tax system actually works. Many of us grow up hearing the phrase “I’m in the 22% tax bracket” and assume that Uncle Sam takes a flat 22% cut of our entire paycheck. Fortunately, that is a complete myth.
The federal income tax system is progressive, meaning your tax rate increases as your taxable income increases. Think of your taxable income as water filling a series of buckets. Each bucket represents a tax bracket with its own fixed rate. The first bucket must be completely filled before any water spills over into the second bucket, and so on.
For example, when your income rises and crosses the line into a higher bracket, only the dollars in that new, higher bucket are taxed at the higher rate. The money in your lower buckets remains taxed at those lower rates.
To find out exactly where your income falls, you can use the interactive BriskTool Tax Bracket Calculator 2026. This tool visualizes how your money is distributed across these progressive buckets, helping you avoid unexpected surprises when you file.
Understanding this progressive structure is key to mastering The Hidden Tax Understanding Bracket Creep, where inflation can quietly push you into a higher bracket without a real increase in your purchasing power.
Marginal vs. Effective Tax Rates
To navigate your taxes like a pro, you need to understand the difference between your marginal tax rate and your effective tax rate:
- Marginal Tax Rate: This is the tax rate applied to the very last dollar you earn. If you are a single filer with a taxable income of $75,000, your marginal tax rate is 22%. If you earn one more dollar, that dollar will be taxed at 22%.
- Effective Tax Rate: This is your actual, average tax rate. It is calculated by dividing your total tax liability by your total taxable income.
Because of the progressive bucket system, your effective tax rate is always lower than your marginal tax rate. Let’s look at a single filer earning $75,000 in taxable income. While their marginal rate is 22%, their actual federal income tax bill is $8,114. This means their effective tax rate is only 10.82%.
Why does this distinction matter? Use your marginal tax rate when making financial decisions on the margin—such as deciding whether to work overtime, take on a side hustle, or make a pre-tax contribution to a retirement account. Use your effective tax rate for broad budgeting and to understand what percentage of your total income is actually going to Uncle Sam.
The Impact of Bracket Creep and Inflation
Every year, the IRS adjusts tax brackets, standard deductions, and various other tax provisions to account for inflation. The government uses a metric called the Chained Consumer Price Index (Chained CPI) to make these adjustments.
Without these annual adjustments, we would all fall victim to a phenomenon known as “bracket creep.” Bracket creep occurs when inflation drives up wages, pushing taxpayers into higher tax brackets even though their actual purchasing power hasn’t increased. If you get a 3% raise to match a 3% inflation rate, you aren’t actually any richer—but without inflation-adjusted brackets, you would pay a higher percentage of your income in taxes.
To protect your wallet, it pays to understand how these adjustments work. You can read our guide on how to Beat The Taxman How Inflation Shifts Your Tax Bracket to see how these adjustments keep more money in your pocket.
How to Use a Tax Bracket Calculator to Forecast Your Liability
Forecasting your tax liability doesn’t require a degree in accounting. An online tax bracket calculator can handle the heavy lifting for you, but you need to know what inputs to feed it to get an accurate estimate.
To calculate your federal tax bracket, the tool must distinguish between your gross income (everything you earn) and your taxable income (the portion of your income that is actually subject to income tax).
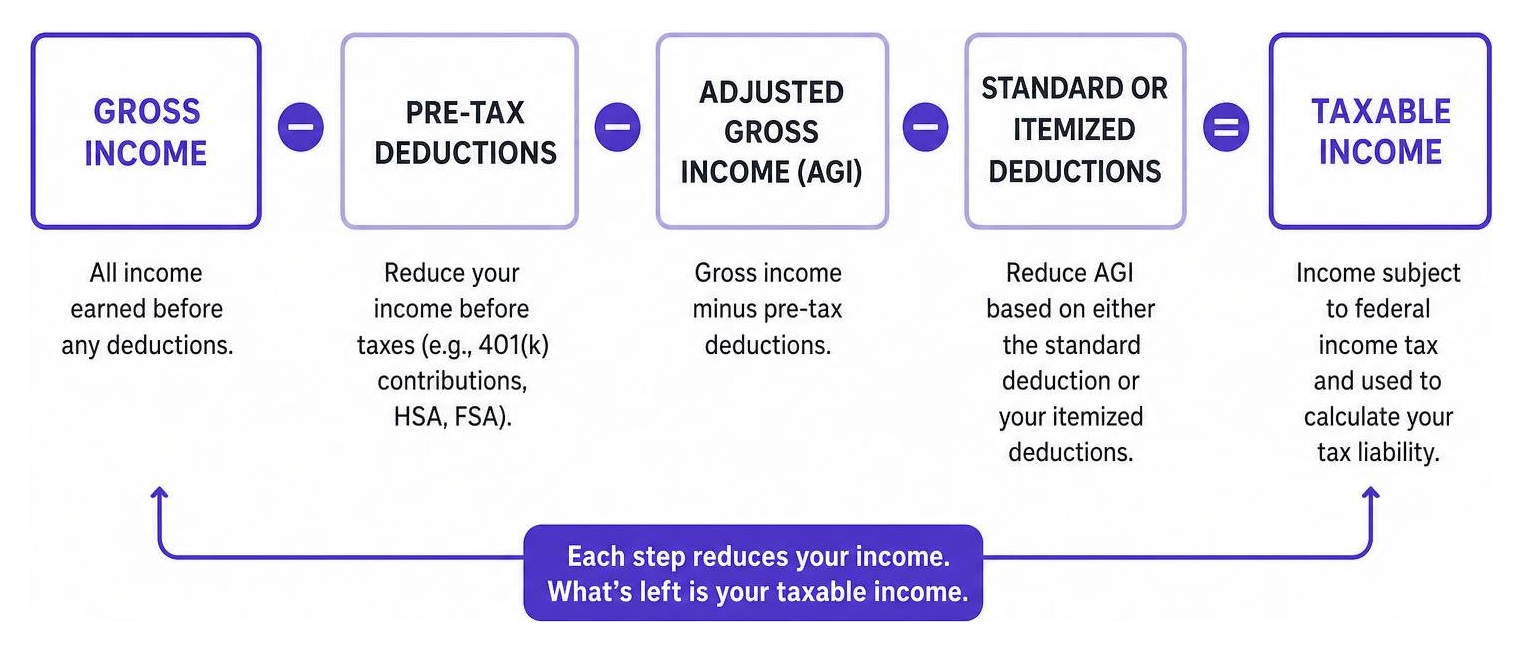
By subtracting your pre-tax deductions (like 401(k) contributions) and your standard or itemized deductions from your gross income, you arrive at your taxable income. This is the final number that a tax estimator uses to calculate your progressive tax brackets and overall tax bill.
Step-by-Step Guide: Navigating a Tax Bracket Calculator
To get the most accurate results from a tax bracket calculator, follow these steps:
- Gather Your Income Sources: Start with your gross annual income. This includes W-2 wages, 1099 independent contractor earnings, business income, interest, dividends, and taxable retirement distributions.
- Subtract Pre-Tax Contributions: Deduct any contributions you plan to make to pre-tax accounts, such as a traditional 401(k), 403(b), or a Health Savings Account (HSA). This gives you your Adjusted Gross Income (AGI).
- Choose Your Filing Status: Select Single, Married Filing Jointly, Married Filing Separately, or Head of Household. Your filing status determines your standard deduction amount and the income thresholds for each tax bracket.
- Apply Your Deductions: Choose whether you will take the standard deduction or itemize your deductions (such as mortgage interest, charitable donations, and state and local taxes). The calculator will subtract this amount to find your taxable income.
- Review the Results: The calculator will apply the progressive federal income tax rates to your taxable income and display your estimated tax liability, marginal rate, and effective rate.
Basic calculators focus on federal income taxes and do not automatically include FICA taxes (Social Security and Medicare), which are flat payroll taxes calculated separately from your progressive income tax brackets.
Why a Tax Bracket Calculator is Essential for Retirement Planning
A tax bracket calculator isn’t just for tax season; it is a vital tool for long-term retirement planning. One of the most common retirement strategies is a Roth conversion, where you move funds from a traditional IRA or 401(k) into a Roth account. You pay income tax on the converted amount now, but the money grows and can be withdrawn completely tax-free in retirement.
To execute a Roth conversion successfully, you must avoid accidentally pushing yourself into a significantly higher tax bracket. By using a calculator, you can see exactly how much “room” you have left in your current marginal bracket.
For example, if you are a single filer in 2026 with $80,000 of taxable income, you sit in the 22% bracket, which goes up to $105,700. This means you can convert up to $25,700 of traditional retirement assets into a Roth account while keeping every converted dollar taxed at that 22% marginal rate. If you convert more, the excess will be taxed at 24%.
To keep your lifetime tax bill as low as possible, check out our Stop The Creep Tips To Avoid Moving Into A Higher Tax Bracket to optimize your retirement contributions and conversion strategies.
Common Mistakes to Avoid When Estimating Your Taxes
When using a tax bracket calculator, watch out for these common pitfalls:
- Entering Gross Income Instead of Taxable Income: If you put your raw salary into the calculator without accounting for the standard deduction or pre-tax retirement contributions, your estimated tax bill will be incorrectly high.
- Ignoring State and Local Taxes: Federal tax brackets are only half the battle. Unless you live in a state with no income tax, you must factor in state tax rates to get a complete picture of your tax burden.
- Forgetting the Standard Deduction: The standard deduction reduces your taxable income before the tax brackets are even applied. Always ensure the calculator is subtracting this amount.
- Assuming the “Marriage Penalty” Applies to Everyone: While high-earning dual-income couples sometimes face a marriage penalty, most couples actually receive a “marriage bonus” because joint filing brackets are roughly double the single brackets.
Comparing 2025 and 2026 Federal Income Tax Brackets
Because the IRS adjusts tax brackets annually for inflation, the income thresholds shift from year to year. Below is a comparison of the federal income tax brackets for single and married filing jointly statuses for the tax years 2025 and 2026.
2025 vs. 2026 Federal Income Tax Brackets
| Tax Rate | 2025 Single Filers | 2026 Single Filers | 2025 Married Filing Jointly | 2026 Married Filing Jointly |
|---|---|---|---|---|
| 10% | $0 to $11,925 | $0 to $12,400 | $0 to $23,850 | $0 to $24,800 |
| 12% | $11,926 to $48,475 | $12,401 to $50,400 | $23,851 to $96,950 | $24,801 to $100,800 |
| 22% | $48,476 to $103,350 | $50,401 to $105,700 | $96,951 to $206,700 | $100,801 to $211,400 |
| 24% | $103,351 to $197,300 | $105,701 to $197,300 | $206,701 to $394,600 | $211,401 to $394,600 |
| 32% | $197,301 to $250,525 | $197,301 to $250,525 | $394,601 to $501,050 | $394,601 to $501,050 |
| 35% | $250,526 to $626,350 | $250,526 to $640,600 | $501,051 to $751,600 | $501,051 to $768,800 |
| 37% | Over $626,350 | Over $640,600 | Over $751,600 | Over $768,800 |
(Note: Certain higher-tier brackets remain unchanged or adjusted based on specific inflation calculations for 2026.)
Standard Deduction and Filing Status Adjustments
The standard deduction reduces your taxable income dollar-for-dollar. For 2025 and 2026, the standard deduction amounts are:
- Single Filers: $15,000 in 2025; rises to $16,100 in 2026.
- Married Filing Jointly: $30,000 in 2025; rises to $32,200 in 2026.
- Head of Household: $22,500 in 2025; rises to $24,150 in 2026.
These adjustments mean that in 2026, a single filer can earn up to $16,100 before owing a single penny in federal income tax.
State Tax Considerations and Geographic Differences
When estimating your overall tax liability, state income taxes can significantly alter your take-home pay. Nine states—including Alaska, Florida, Nevada, South Dakota, Tennessee, Texas, Washington, and Wyoming—have no state income tax on wages.
If you are planning for retirement, geographic tax arbitrage can save you thousands of dollars. Take a look at our analysis of Which States Have The Lowest Tax Burdens to see how moving across state lines might lower your overall tax rate.
We have also ranked the Best States For Taxes In Retirement Ranked to help you keep more of your nest egg. For seniors, exploring State Senior Tax Benefits To Slash Your Property Tax Bill and reading The Ultimate Guide To State Pension Tax Breaks And Exemptions can reveal hidden savings that basic online calculators often miss.
Frequently Asked Questions about Federal Tax Brackets
Does getting a raise ever make you worse off due to taxes?
No. This is one of the most persistent financial myths in America. Because the U.S. tax system is progressive, a raise will never result in you taking home less money than you did before.
Only the dollars that fall within the new, higher tax bracket are taxed at that higher rate. For example, if you are a single filer earning $50,000 and you receive a $10,000 raise, only the portion of that raise that exceeds the 12% bracket threshold is taxed at the 22% rate. You will still take home the vast majority of your raise. Never turn down a promotion or a raise out of fear of moving into a higher tax bracket!
What is the difference between standard and itemized deductions?
The standard deduction is a fixed, no-questions-asked dollar amount that the IRS allows you to subtract from your income based on your filing status. Itemized deductions, on the other hand, allow you to list individual deductible expenses—such as mortgage interest, state and local taxes (subject to the SALT cap), and charitable contributions.
You should itemize only if the sum of your individual deductions is greater than the standard deduction. Since the standard deduction was significantly increased under the Tax Cuts and Jobs Act, roughly 87% of taxpayers now find it more beneficial to take the standard deduction.
If you are close to the threshold, you can use a strategy called “charitable bunching”—grouping multiple years of charitable donations into a single tax year—to exceed the standard deduction and maximize your tax savings.
How do pre-tax contributions like a 401(k) or HSA affect my tax bracket?
Pre-tax contributions are your most powerful tool for immediately lowering your tax bill. When you contribute to a traditional 401(k) or a Health Savings Account (HSA), those dollars are subtracted from your gross income before your tax brackets are calculated.
In 2026, the contribution limit for a 401(k) is $24,500 (plus an additional $8,000 catch-up contribution if you are 50 or older). The 2026 HSA contribution limits are $4,400 for individuals and $8,750 for families.
By maximizing these accounts, you can lower your taxable income, potentially dropping yourself into a lower marginal tax bracket and saving thousands of dollars at your highest tax rate.
Conclusion
Forecasting your tax liability is a cornerstone of smart financial planning. By understanding how progressive tax brackets work and using a tax bracket calculator, you can make informed decisions about your career, your investments, and your retirement contributions.
As you look toward your retirement years, income taxes don’t stop when you stop working. Your Social Security benefits may also be subject to federal income taxes depending on your combined income.
To make sure you are prepared for how Uncle Sam will treat your retirement income, read our comprehensive guide: Taxing Your Golden Years A Guide To Social Security Tax On Benefits.
For a deeper dive, you can also explore our resources on Uncle Sams Cut Understanding Taxes On Social Security and check out the Social Security Taxable Income Guide 2026 to keep your retirement years as tax-efficient as possible.